
.webp?language=en-US)

by John Kamp
Can non-natives play nice with natives? A rework of a butterfly garden in Minnesota sought to find out.
Part 1 in this three-part series was published on The Field last week.Year 1: 2019 and What We Started With
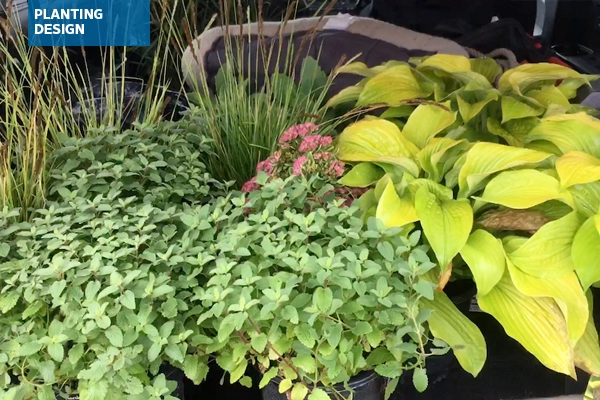
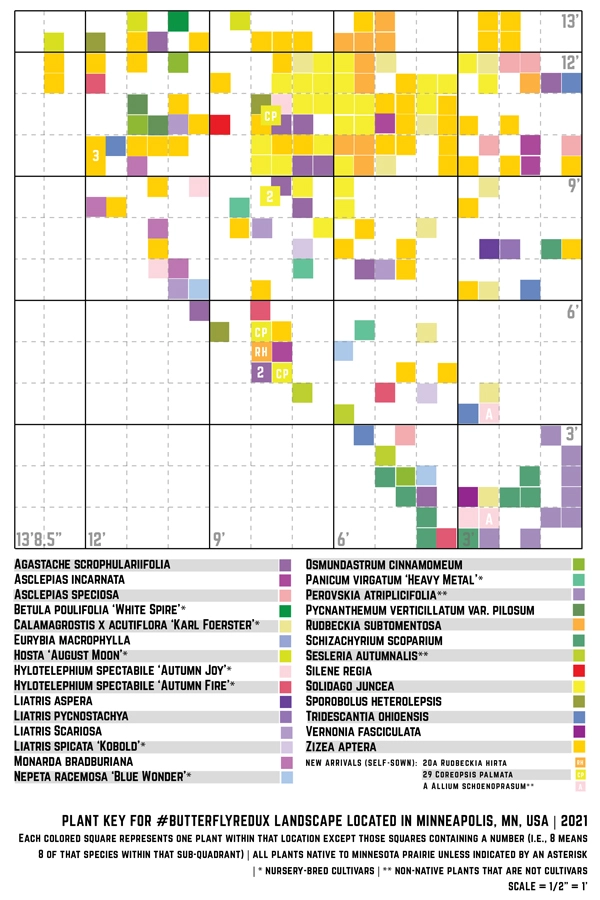
For the plant palette of the redesign, I selected seven plants that would serve double duty as both the “non-native” half of the experiment and the more discernible structure of the landscape. Some of these were sterile cultivars while others had the potential to self-sow. These sterile plants were included because the experiment sought to look at not just whether non-natives and/or nursery-bred cultivars will crowd out native plans, but also whether native plants will crowd out non-natives.
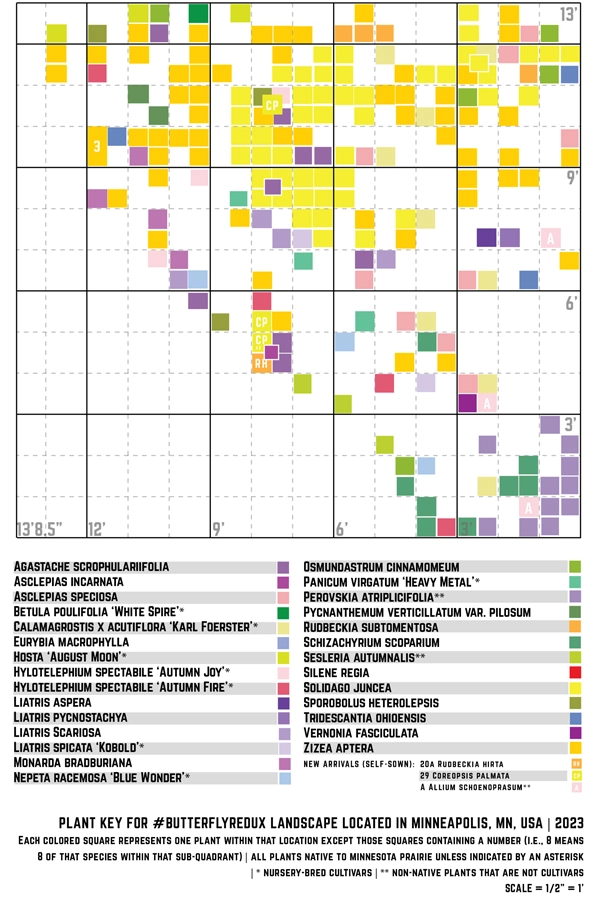
The selected plants included Calamagrostis x acutiflora ‘Karl Foerster’ (sterile cultivar), Hosta ‘August Moon’, Hylotelephium spectabile ‘Autumn Fire’, Hylotelephium spectabile ‘Autumn Joy’, Nepeta racemosa ‘Blue Wonder’, Panicum virgatum ‘Heavy Metal’ (sterile cultivar)’, and Sesleria autumnalis (sterile in most climates). These I arranged in more of an overtly structured way, with the ‘Karl Foerster’ planted along a kind of grid toward the back and middle of the landscape and the others spaced at intervals or in clusters that would ideally tell the eye that they were planted there intentionally. Some of the existing native plants—especially those that naturally have more structure when not in bloom—I did move as well to also give the eye the sense that they had been intentionally planted there. These included the Liatris pychnostachya and the Monarda bradburiana.
The rest of the existing plants I left where we had planted them two years prior when we initially planted the garden, or where they had self-sown after the initial planting. These existing plant species included all of those in the original nursery-curated butterfly kit, and some plants that pre-dated the butterfly garden itself but were not removed when we planted it in 2017—including Betula populifolia ‘Whitespire’, Perovskia atriplicifolia, Liatris spicata ‘Kobold’, and Osmandrum cinnamomeum. Ultimately, the number of combined native/non-native species within the space totaled 28.
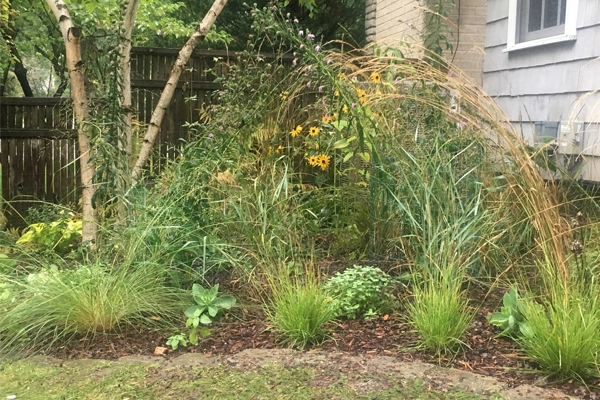
Lastly, we laid down a thin layer of a super-fine mulch, simply to give the space a finished look just after the redesign (this is a landscape that had to double as experiment and ornamental space). However, we did not lay any more down after the first year.
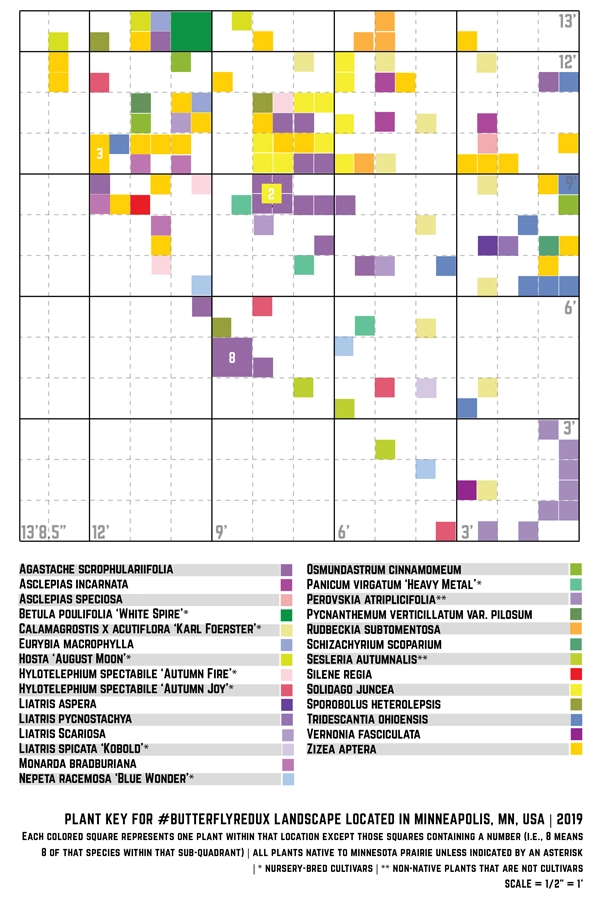
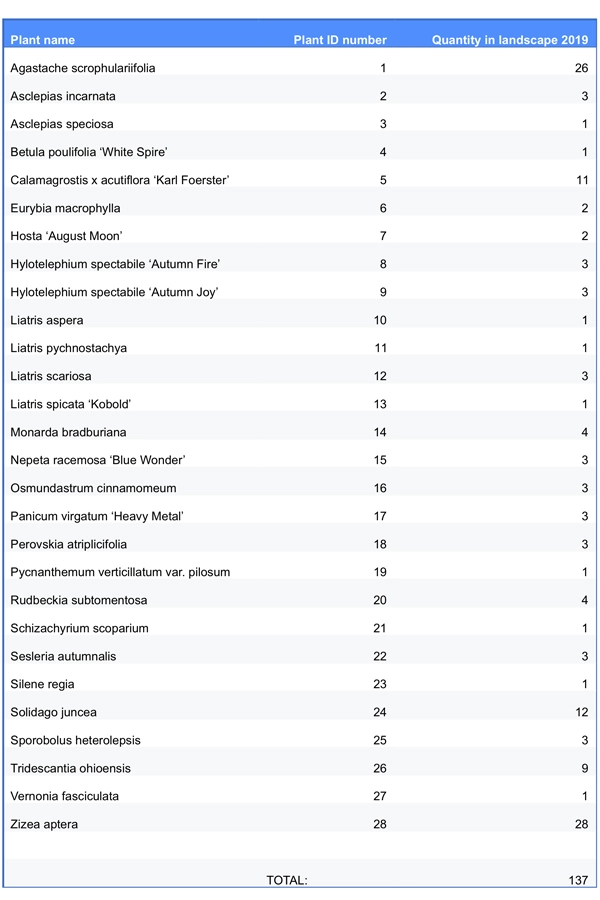
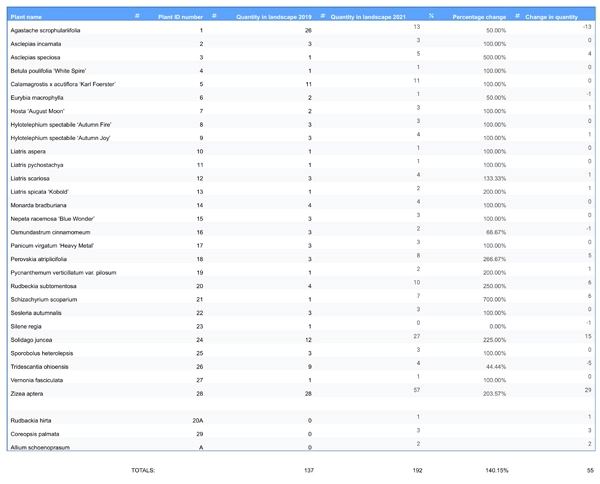
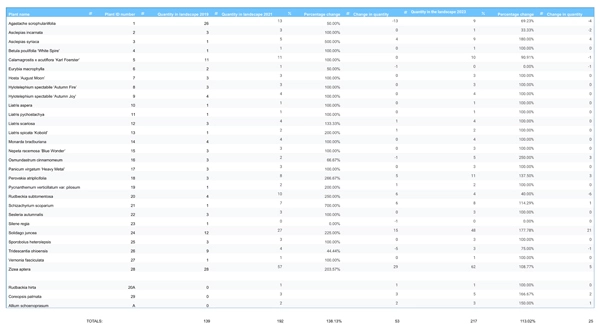
Next we laid a grid of 3’ x 3’ squares atop the landscape and within each square documented what was growing in terms of species and quantity. While the initial butterfly garden had been planted in 2017, already by 2019 there were certain plants that had found the site to be quite suitable for multiplying. These included (in descending order):
- Zizea aptera (counted 28),
- Agastache scrophularifolia (counted 26),
- Solidago juncea (counted 12), and
- Tridescantia ohioensis (counted 9).
With the exception of the ‘Karl Foerster’, of which we had planted 11, the quantities of the other plants remained at four or below. By the end of the first-year survey, we had counted 137 total plants in the landscape.
So the question now remained: Would some of these proverbial “winners” continue to dominate, or would some retreat into the background or disappear altogether? And would any of the cultivars start to self-sow within the site and compete for space with the other plants?
Year 3: 2021
COVID threw a wrench in our counts for 2020, so once we were vaccinated and able to travel again, I headed back to Minnesota in 2021 to use the same grid of 3’ x 3’ squares in the same locations to document how the landscape had changed. And indeed, certain plants had begun filling in the site with a kind of aplomb, namely the Zizea aptera, which had now totaled 57, a 203% increase from its previous 28. Others that had continued the march upward were the Solidago juncea (counted 27 / a 225% increase), Rudbeckia subtomentosa (counted 10 / a 250% increase), and the Perovskia atriplicifolia (counted 8 / a 226% increase). The Perovskia we had not planted but had existed on the periphery of the site at planting time in 2019. On the other hand, the Agastache scrophularifolia, which we had planted back in 2017 and had started to populate the site pretty extensively by 2019, had decreased in number from 26 to 13. And the Tridescantia ohioensis had gone from 9 to 4.
A few new arrivals had appeared as well. A Rudbeckia hirta, presumably from another landscape just 10 feet away, had self-sown in the space, along with three Coreopsis palmata (also likely from the nearby landscape), and two Allium schoenoprasum, which had come from an existing clump just to the east of the landscape outside the study area.
As for the cultivars I had planted, they had come back from the long winter unscathed but had not self-sown at all. With sterile plants like the ‘Karl Foerster’, this obviously wasn’t surprising, but other cultivars such as the Nepeta racemosa ‘Blue Wonder’, which will self-sow under the right conditions, hadn’t planted themselves anywhere other than where I had planted the original three.
As for the total plant count within the space? We were at 192, a 140% increase over that of 2019.
Year 5: 2023
2022 was the year of extensive travel for our book, Dream Play Build, which had just come out and which made it difficult to block out time to travel back to Minnesota to do the counts that year. Fast forward to 2023, and I finally had a bit of downtime to do another round of counts.
By 2023, there were a total of 217 plants in the landscape, a 113% increase from 2021. Truth be told, by this point some of the 3' x 3' squares within the grid were so densely packed with plants that to do the counts another year might have proven beyond human comprehension or capability—at least beyond mine. Either way, the number of plants reproducing within the space had slowed slightly compared to the time interval of 2021 to 2023 (from 140% down to 113%).
The plants that had previously dominated the space were still there, with the Solidago juncea showing the largest bump in numbers, going from 27 to 48, a 178% increase; whereas the Zizea aptera had increased in number but not in the way it had before, going from 57 to 62, just a 108.77% increase. Meanwhile, a new plant had started to emerge as one that was making its presence known, Asclepias syriaca, with 3 counted in 2019, 5 in 2021, and 9 in 2023. In fact, in my casual observation in 2024, the plant had appeared to have multiplied even more, numbering near 20, with one starting to grow within a clump of ‘Karl Foerster.’
Those plants that had gone from being more dominant in the garden to now declining included the Agastache scrophularifolia, going from 13 to 9, the Rudbeckia subtomentosa, going from 10 to 4, and the Asclepias incarnata, going from 3 to 1. My guess regarding the decline of the Agastache scrophularifolia and the Rudbeckia subtomentosa is not enough moisture, as 2023 was a particularly hot and dry summer, and both of these plants tend to like at least mesic, but preferably wetter, conditions. Asclepias incarnata is a short-lived plant to begin with, so its decline in numbers didn’t surprise me. As for the cultivars we had planted in 2019, all had survived another winter except one of the ‘Karl Foerster’ specimens, going from 11 to 10.
As for the new arrivals in 2021, the Rudbeckia hirta had stayed at 1, the Coreopsis palmata had increased to 5, and the Allium schoenoprasum had increased from 2 to 3.
This series continued the following week—go on to part 3!
John Kamp is a landscape and urban designer and licensed landscape contractor (C-27 #1039171) based in Oakland, CA, where he runs the landscape, design, and community-engagement practice Prairieform. He is co-author of the book Dream Play Build: Hands-On Community Engagement for Enduring Spaces and Places (Island Press 2022).