
.webp?language=en-US)


by Kal Almo, ASLA, AIA, SITES AP, Jack R. Garcia, Affiliate ASLA, Jenny Zhang, ASLA, AICP, and Lauren Patterson, ASLA, PLA

What is Technology in Urban Design and How is Technology Used to Make, and Facilitate, Urban Design Plans
Technology in urban design refers broadly to the digital tools and systems practitioners use to enhance the planning, design, and management of cities and urban areas. Today, technology is constantly evolving and is a central part of our practice. The tools and systems that are used in urban design work vary depending on the scale and scope of the overall environment and the actual setting. Typically, these projects include large multi-disciplinary teams that communicate in a variety of ways to visualize the future. The existing and the new technology has enhanced collaboration among architects, engineers, planners, and landscape architects, while also creating challenges due to the growing number of systems and tools used in project development. This article discusses the history of technology in urban design and gives a brief overview of the tools, programs, and data that is used to design urban environments.
History
Urban design has consistently reflected the technologies available to those shaping the built environment. From as far back as 2000 BCE until the early 21st century, the evolution of urban form has been closely tied to innovations in tools, materials, and systems.
In ancient cities such as El Lahun (Egypt), Mohenjo-Daro (Pakistan), Hamadan (Iran), Erlitou (China), and Piraeus (Greece), urban planning expressed significant development. These cities demonstrated an ability to successfully organize urban layouts, sewage systems, and monumental public spaces; in the process, they became regional centers. The tools of the time—manual surveying instruments, compasses, and measuring rods—enabled planners to align streets and structures with remarkable precision. These cities incorporated zoning and predetermined (often orthogonal or radial) street layouts, literally laying the foundations for centuries of urban design analysis and urban planning theory.
The Industrial Revolution, beginning in the 1700s, marked a turning point in urban development. The rise of coal-fueled steam power, mechanized production, and rapid mass transit (railroads) led to rapid urbanization and the emergence of industrial cities. The populations of industrial cities often grew faster than aspects of the supporting infrastructure could accommodate. Technological innovations such as blueprints and the widespread use of precise drafting tools allowed for more standardized and scalable documentation of urban interventions.
The early 20th century introduced the automobile as a dominant force in shaping cities. The widespread adoption of cars led to the development of suburbs, highways, and zoning laws that privileged vehicular mobility. Design technology was still rooted in analog methods and computers were slowly making inroads into design processes. Most designers still used drafting desks, pens, rulers, and physical models to visualize and communicate their ideas despite the increase of city-scale and urban renewal projects. While the tools were manual, the scale and ambition of urban interventions were unprecedented. The scope, complexity, and funding available led to some designers engaging in new technologies. As urban design became a distinct academic and professional discipline (a term solidified at the Urban Design Conference organized by José Luis Sert in 1956), the tools used to develop cities became more specialized; computers helped develop and assess traffic models and land-use plans. Designers and planners were able to analyze complex systems and make data-driven decisions.
In the 1980s and 1990s, computer use and digital technologies continued to inform how urban design was practiced. Two of the most influential tools introduced during this period were geographic information systems (GIS) and computer-aided design (CAD). These technologies revolutionized how urban designers analyzed, visualized, and communicated spatial information.
GIS enabled planners to collect, manage, and analyze spatial data with unprecedented precision. It allowed for the layering of different types of geographic information—such as land use, transportation networks, and environmental data—facilitating more integrated and evidence-based planning decisions. The ability to visualize urban change over time and simulate future scenarios made GIS a powerful tool for both strategic planning and community engagement. GIS also allowed for the digitization of historical maps and the creation of spatial databases that could be integrated using standard database tools.
At the same time, CAD software began to replace traditional hand-drawing methods. CAD allowed urban designers to produce more accurate and detailed plans, elevations, and sections, and to make rapid revisions as projects evolved. The integration of CAD with GIS in the late 1990s enabled a more seamless transition between spatial analysis and design visualization. This convergence allowed for the development of early 3D modeling environments, which began to support more immersive and interactive urban design processes.
The 1990s also saw the rise of urban simulation software and early decision-support systems; as computing power increased, so did the power and abilities of the design applications. TRANUS and MEPLAN, developed in the 1980s, meshed economic and transportation modeling, allowing planners to test the potential results of policy and investment structures, informing paradigms for urban design parameters. These systems laid the groundwork for later platforms like UrbanSim, which emerged in the late 1990s and enabled microsimulation of household behavior, land markets, and transportation systems.
Computer-aided design (CAD) tools such as AutoCAD became increasingly popular among architects and urban designers, allowing for precise 2D drafting and later, basic 3D modeling. Simultaneously, geographic information systems (GIS) began to gain traction in urban planning departments, particularly as hardware costs declined and software capabilities improved. Early GIS platforms like SYMAP and GRID laid the foundation for more advanced systems such as ArcInfo and ArcView, which became more widely used in the 1990s. These tools gave designers efficient means of overlaying spatial, demographic, environmental, and infrastructure information. As application interoperability increased, particularly between GIS and CAD, workflows developed that moved quickly from existing conditions documentation to spatial analysis and design visualization. Additionally, specialized tools like Space Syntax provided new methods for analyzing spatial configurations and pedestrian movement, influencing the design of more walkable urban environments (i.e. showing that people tend to avoid narrow alleys behind convenience stores).

The early 2000s saw the emergence of more integrated digital tools, including early forms of Building Information Modeling (BIM) and urban simulation software. These technologies allowed for more dynamic modeling of urban systems and greater stakeholder engagement. While the full realization of smart cities would come later, the foundational technologies and planning philosophies were already in place by 2010.
Current Technology and Use in Practice
In 2017, The Economist proclaimed that “the world’s most valuable resource is no longer oil, but data.” In the decades before, oil powered industry, innovation, and influence; today, data drives decision-making, automation, and adaptation. This transformation is especially poignant for urban professionals tasked with envisioning, shaping, and stewarding the urban fabric in a rapidly digitizing world.
Much like oil, data is not inherently valuable in its raw state. It must be extracted, cleaned, structured, and refined before it can become useful. When properly harnessed, however, it empowers designers to respond to space and form, as well as to context, behavior, and performance. Paired with technology, data is fueling a revolution in urban design—accelerating collaboration, expanding visualization, and enabling smarter, more responsive decision-making at every scale of practice.
Technology is now woven into nearly every aspect of daily life. In project work, it has restructured workflows, reshaped communication, and redefined how we envision places. In the context of urban design, technology can be understood through three core functions: capturing, processing, and output.
Capturing involves documenting existing conditions using tools like tablets, smartphones, digital cameras, and drones. These tools capture real-time data from human and aerial perspectives, including images, video, and sensor readings, forming the foundation of any data-driven design process. Portable devices such as tablets and cell phones are valuable for quick data collection that can capture both static and dynamic aspects of the built environment from a human eye-level perspective. Drones provide a bird’s eye view as well as top-down imagery to complement the human perspective visuals.
Processing occurs when this raw information is analyzed. Here, powerful computing tools use custom algorithms, modeling software, and parametric design scripts to synthesize data. Today, both desktop and mobile devices are capable of processing mass datasets. Tablets have a distinct advantage for their portable sizes, touchscreen interfaces, and increasing compatibility with design applications. Platforms like GIS, Rhino, Revit, and Civil 3D allow designers to structure and visualize that information, while tools like Dynamo and Grasshopper support rule-based design automation.
Design software has advanced from static drafting programs to dynamic, intelligent environments. Traditional platforms like AutoCAD have evolved to support 3D modeling and parametric integration. Tools such as Revit and Rhino serve as backbones of model-driven design; SketchUp and CityEngine allow intuitive massing studies at multiple scales; and GIS platforms deliver rich contextual analysis.

More recently, AI-powered features are being integrated into nearly every application—a few examples: Autodesk Forma’s predictive tools, Photoshop’s generative fills, or Midjourney’s design visualizations. Parametric and generative design programs are unlocking new ways to solve spatial problems, enabling rapid iteration across multiple scenarios. Programs like TestFit and Spacemaker (now Forma) exemplify how zoning, land value, solar access, and density models can be algorithmically balanced.
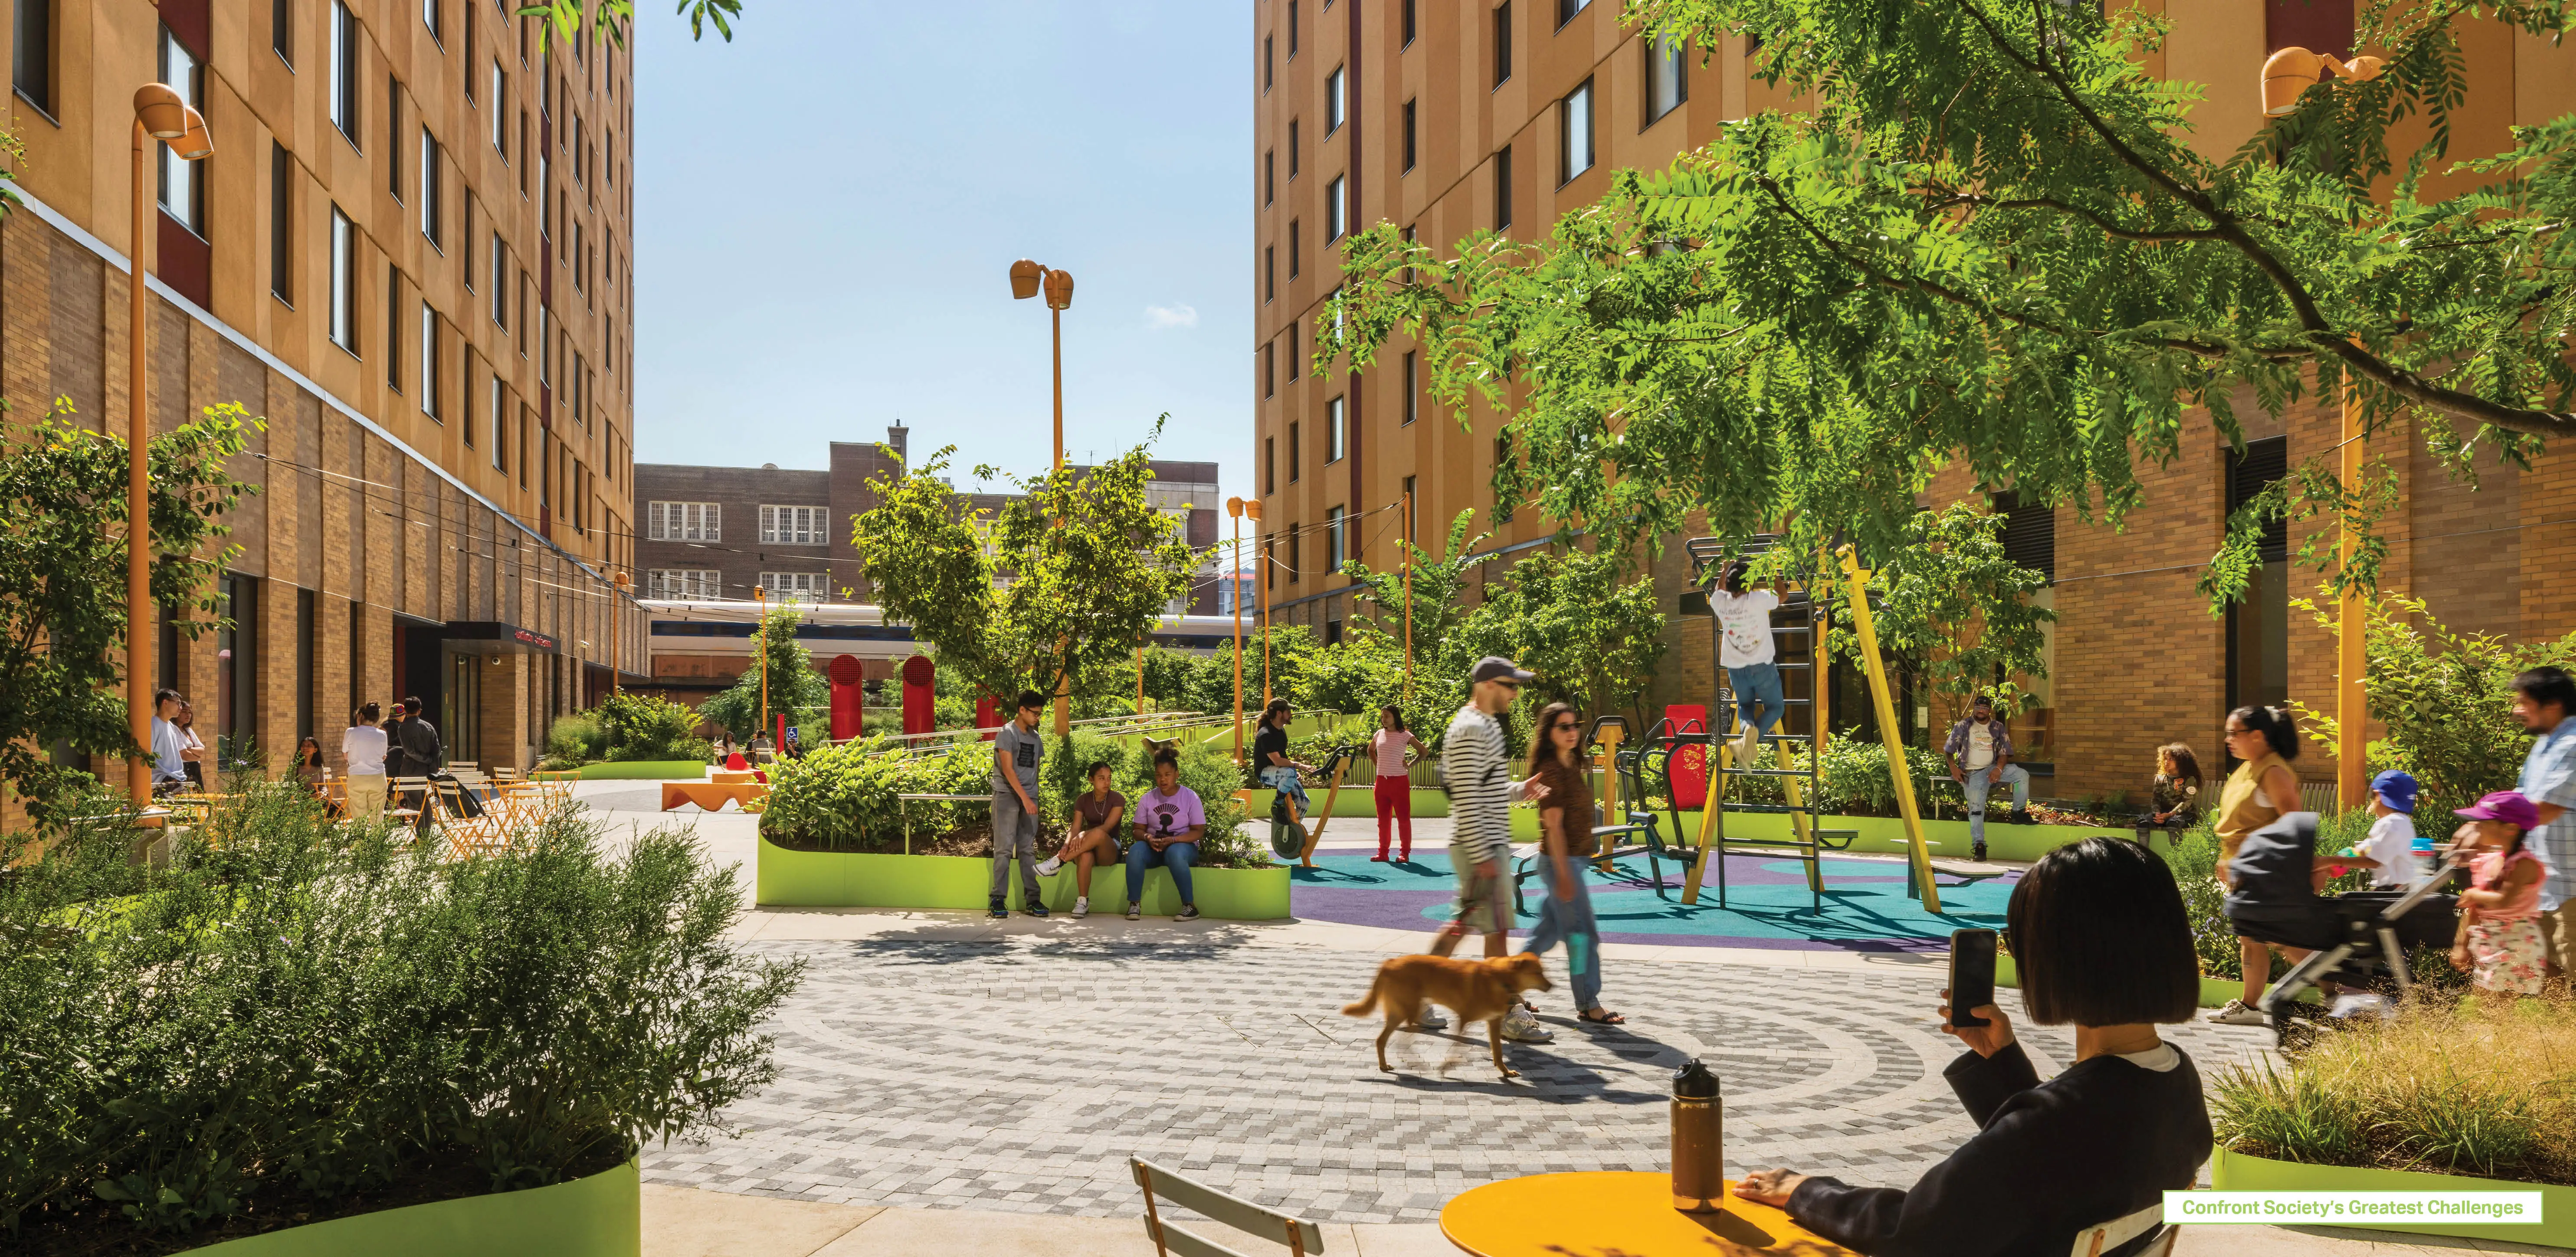
Output translates insight into deliverables. Today, design presentations often go beyond PDF drawings and printed boards. Digital outputs include immersive AR/VR environments, web-based models, and interactive simulations that communicate not just form, but intention, performance, and experience. These visualizations allow clients, stakeholders, and community members to immerse themselves in projects, enhancing participatory planning, empathy, and alignment. Ultimately, the most profound output remains the built environment itself when the design concept comes to life.
But none of this technology functions without high-quality data. Data is the substrate that fuels every algorithm, every simulation, every digital twin. For urban designers, data offers a lens through which cities become legible, dynamic, and measurable.
So, what is data? At its core, data is just information—numeric, spatial, behavioral, environmental—collected through digital or analog means. Structured correctly, data enables us to compare options, forecast performance, and optimize space. It turns subjective guesses into evidence-based insights. To be usable, data must be structured. This means translating messy, complex, real-world conditions into discrete, quantifiable parameters. Whether we’re modeling rainfall patterns, pedestrian flows, zoning overlays, or street tree health, we must define the variables that matter and create systems that allow for efficient processing.
Once structured, data must be fed into tools that allow for visualization, manipulation, and decision-making. This may include GIS overlays, LOD-based BIM models, parametric massing strategies, or environmental simulations. Yet integration is the true magic. Data must be mixed across sources to reveal meaningful relationships: sun exposure with energy codes, pedestrian density with retail strategies, topography with stormwater capture. It’s this fusion of information that makes our work smarter, more predictive, and more sustainable.
The intersection of technology and data in urban design represents more than just efficiency—it represents intelligence. This intersection shifts our focus from reactive design to anticipatory design, from static plans to living systems, and from guesswork to precision.
Still, we must remember: analysis needs human interpretation. The quality of our outcomes depends on the quality of the data, and the creativity and ethics of the people interpreting it. While AI and automation are changing the game, they are not a substitute for critical thinking, community engagement, or aesthetic judgment. They are powerful tools, but tools nonetheless. As with any major leap—like when CAD first redefined drafting—our field is now faced with re-evaluating not just our tools, but our methods, roles, and responsibilities. How will we teach technology in design education? How do we govern the use of sensitive data? How do we ensure digital equity in community-driven projects?
Urban design is fundamentally a collaborative and human-centered practice, drawing from architecture, ecology, engineering, sociology, and policy. While technology doesn't change this foundation, it enhances our ability to coordinate across disciplines, simulate outcomes, and visualize future possibilities. As professionals, our goal is not simply to use technology, but to direct it—to guide its use toward sustainability, inclusivity, resilience, and beauty. We must remain vigilant, adaptable, and informed, because just as oil shaped the 20th century city, data and technology are shaping the cities of tomorrow. By embracing this transformation with curiosity, responsibility, and imagination, we don’t just adapt to change—we lead it.
Kal Almo, ASLA, AIA, SITES AP, is an Architect and Landscape Architect at AECOM. Kal is also co-chair of the Urban Design Professional Practice Network (PPN).
Jack R. Garcia, Affiliate ASLA, is Virtual Design & Construction (VDC) Team Principal at EDSA. Jack is also part of the Digital Technology PPN leadership team.
Jenny Zhang, ASLA, AICP, is an Urban Designer at WSP USA. Jenny is also co-chair of the Urban Design PPN.
Lauren Patterson, ASLA, PLA, is a landscape architect and planner with 10 years of experience leading projects from large-scale regional planning initiatives to detailed immersive designs. Currently employed by Pond in Charlotte NC, she is passionate about improving the world of transportation and development through smart design and collaboration. Lauren is immediate past co-chair of the Urban Design PPN.