.webp?language=en-US)

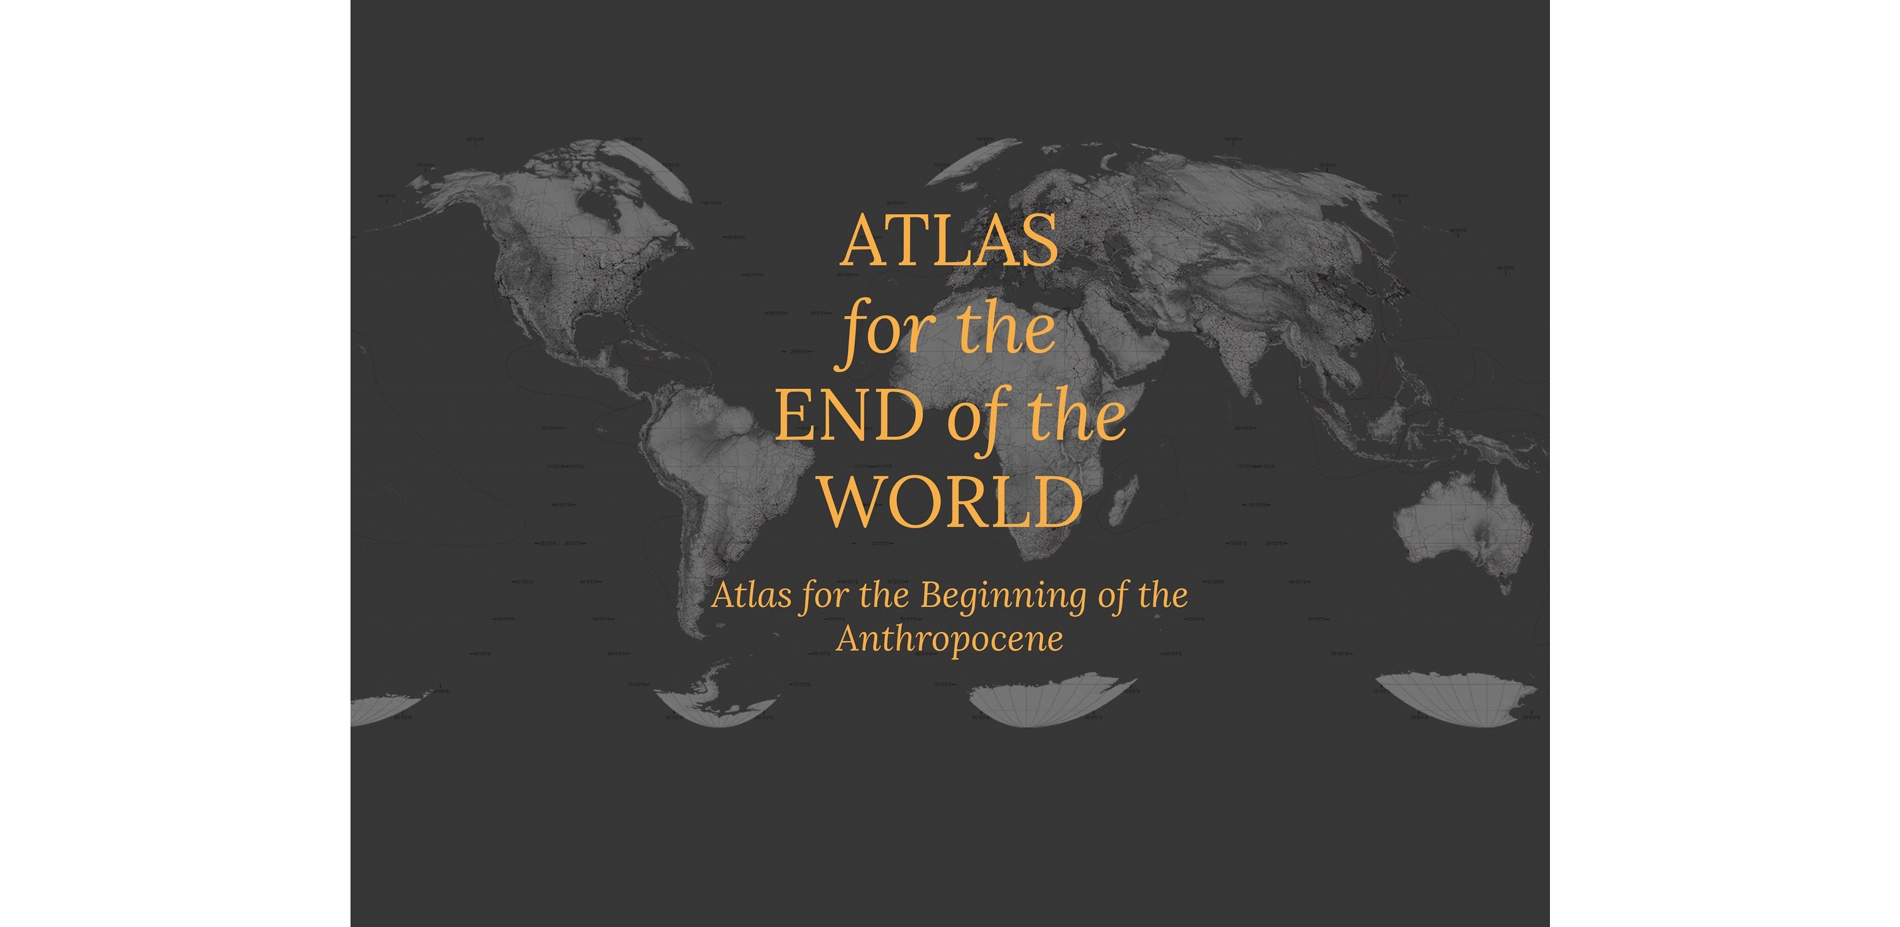
Atlas for the End of the World - Atlas for the Beginning of the Anthropocene


The research is asking important questions in a new way and pointing out the relationships, the tensions, and the conflicts where we need to pay attention.
Awards Jury
-
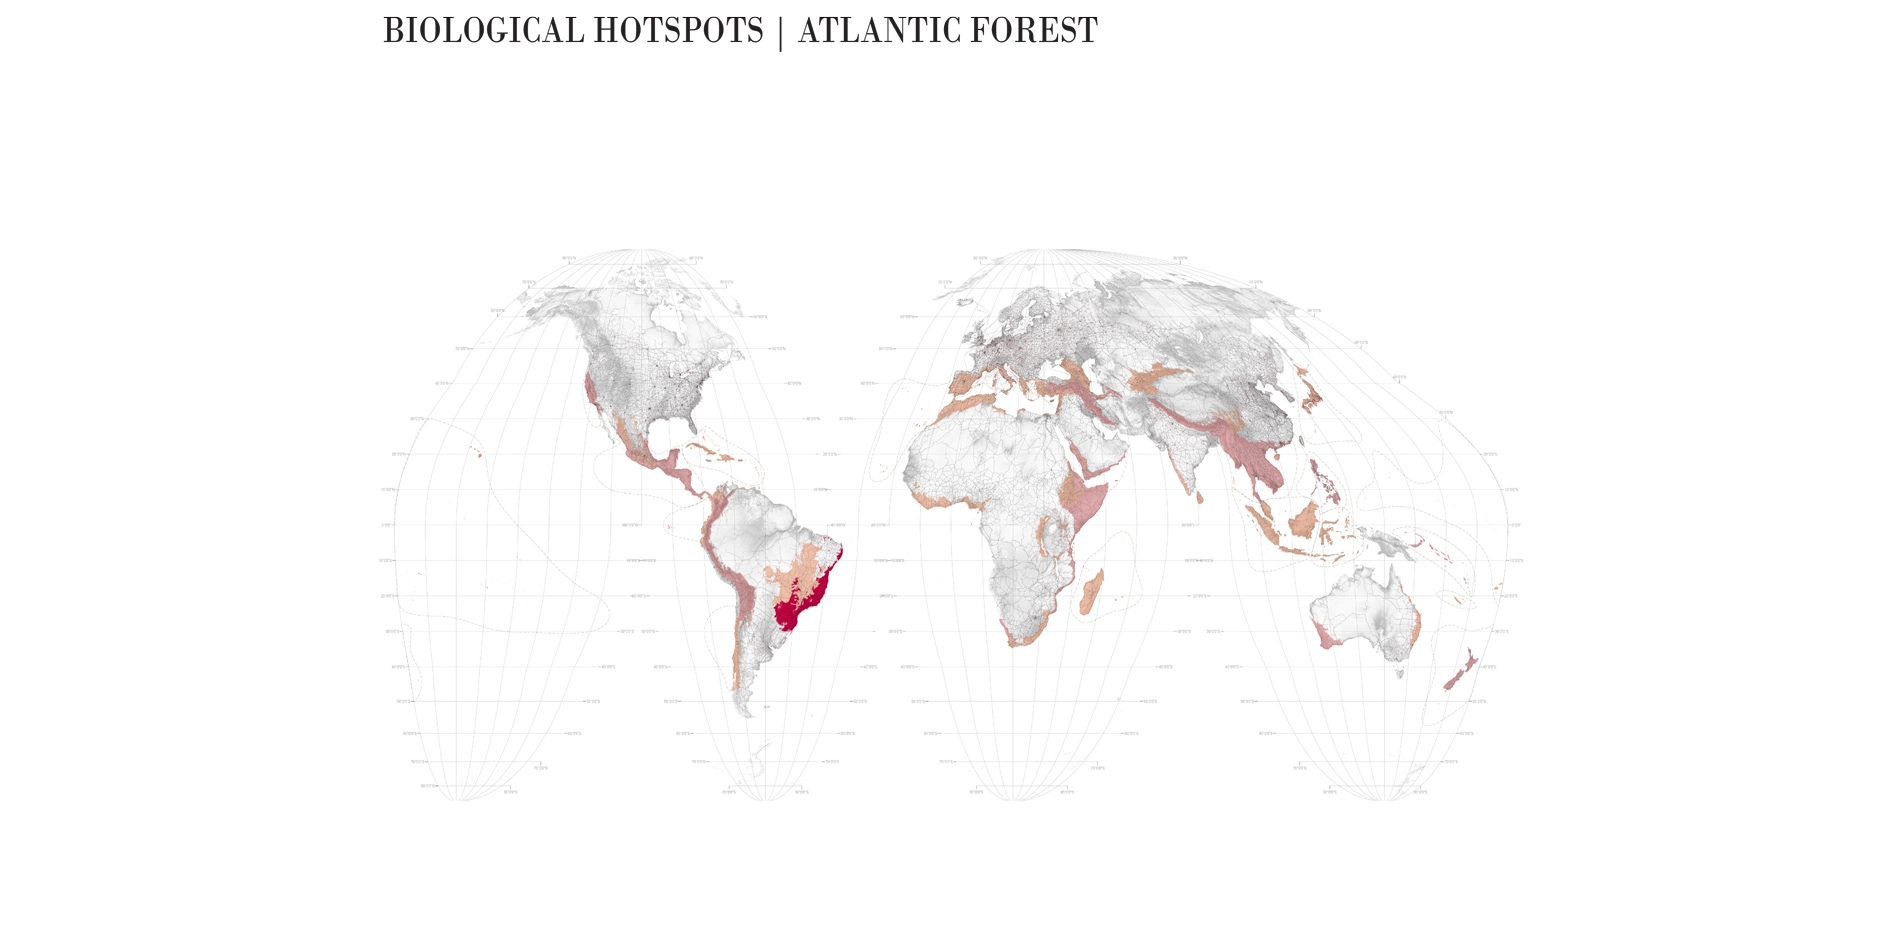
4 years in the making, this web-based interactive Atlas surveys the status of, and conflicts between conservation, land-use and urban growth in the world's 36 biodiversity hotspots - regions which by definition harbor the most threatened and irreplaceable biodiversity on earth.
Specifically, the Atlas shows how the hotspots and their 391 constituent ecoregions are performing with regard to meeting 2020 United Nations protected area targets under the legally binding Convention on Biological Diversity. The Atlas also identifies 383 of the 422 major cities in the hotspots which are sprawling, and forecast to continue to sprawl, in direct conflict with remnant habitat and endangered (Red Listed) species.
Through its analysis of both large-scale land-use and peri-urban growth that is in conflict with biodiversity, the Atlas serves as a geopolitical tool for planners and conservationists to focus and prioritize their efforts. Whilst this is valuable and important work in and of itself, the Atlas also prepares the ground for the involvement of landscape architecture in regions where the profession's skills are most needed.
-
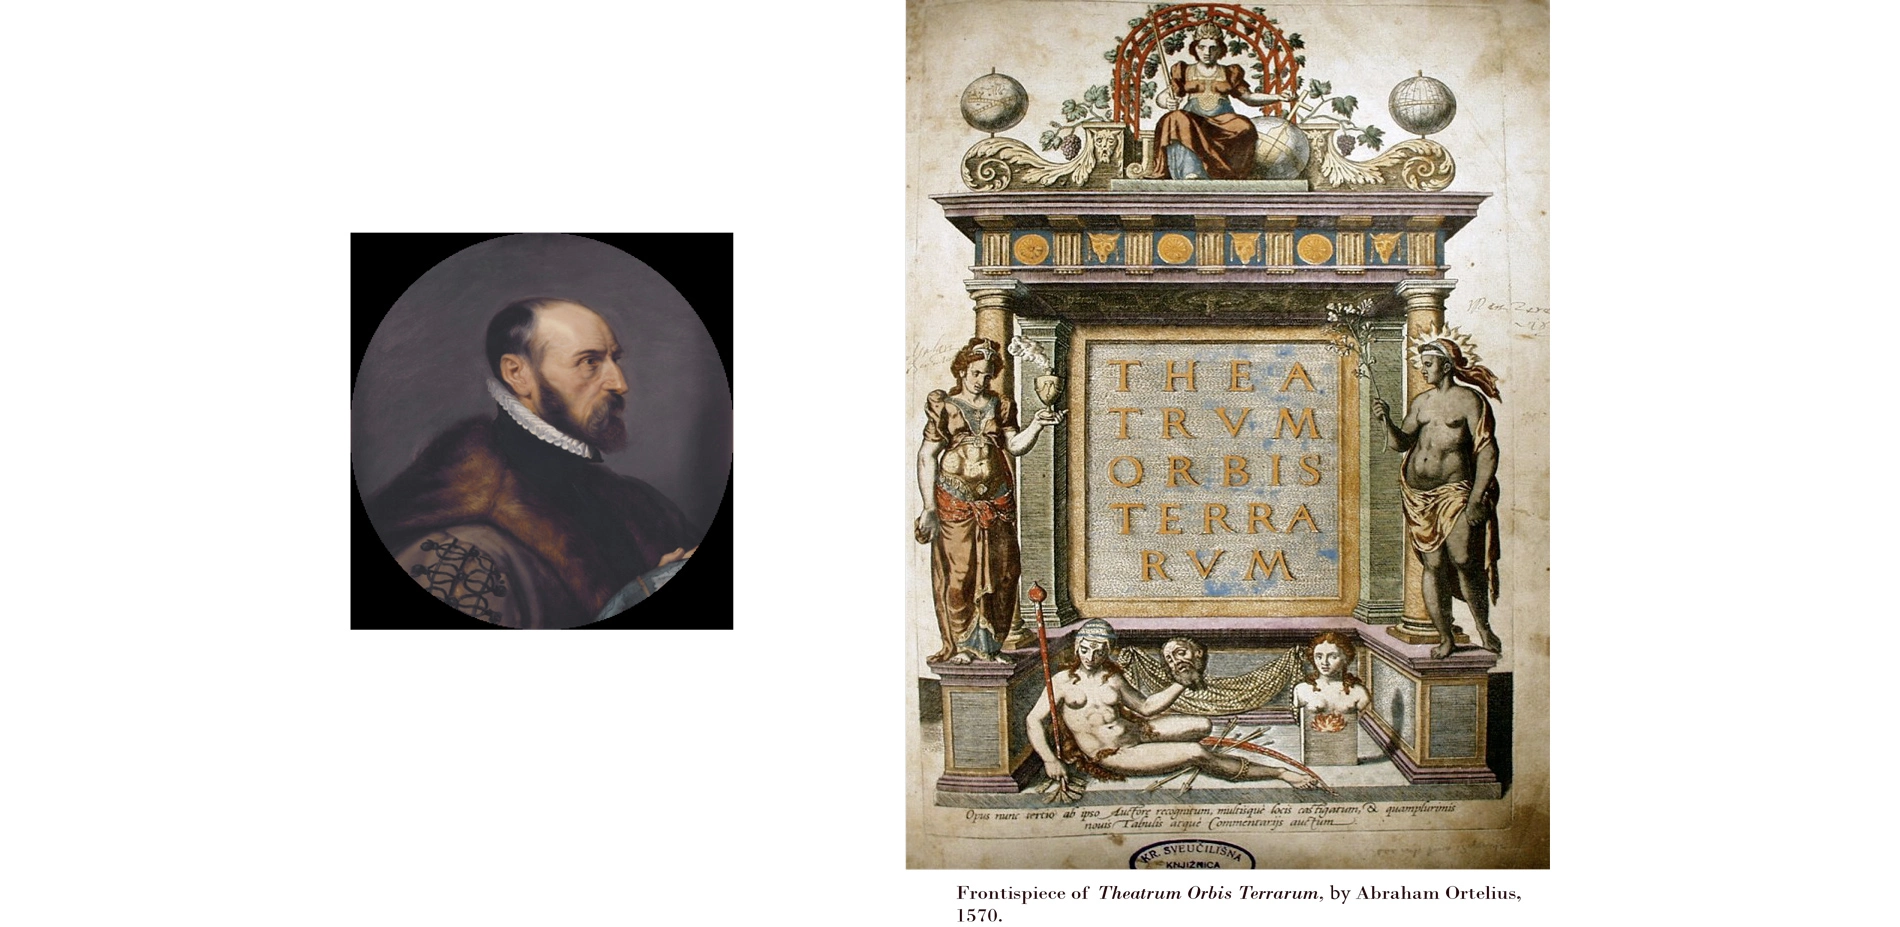
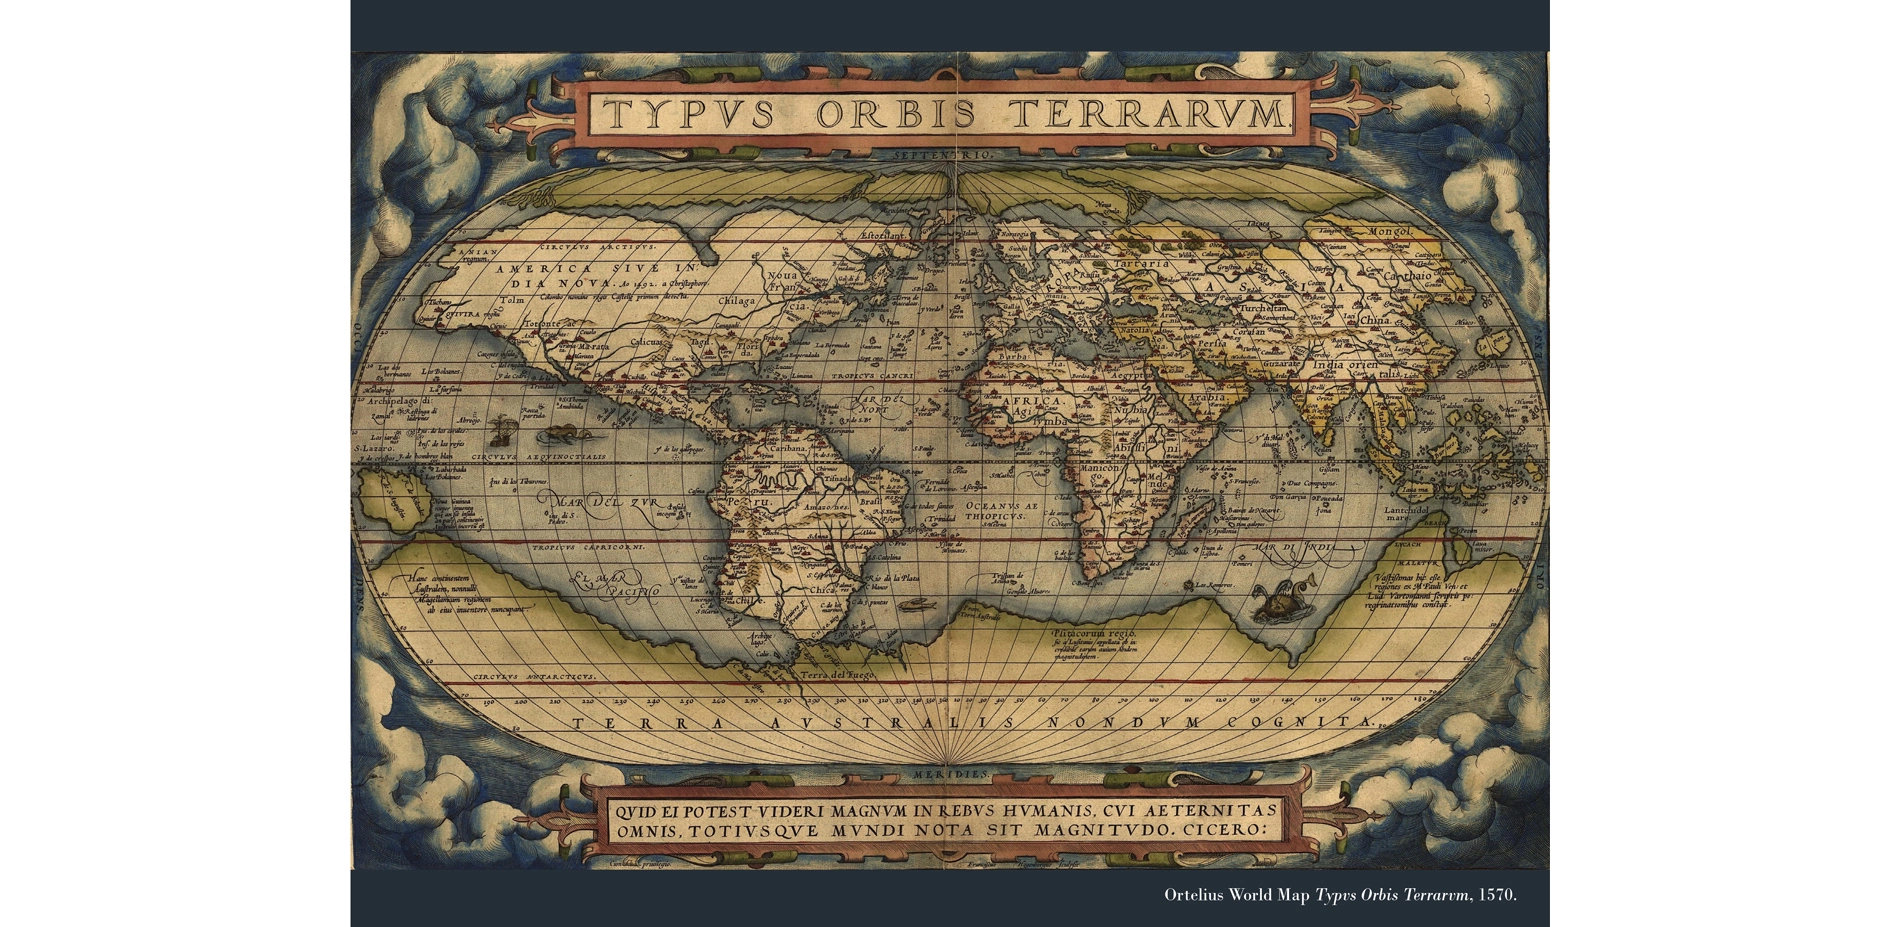
The world's first atlas, the Theatrum Orbis Terrarum (Theatre of the World) was published in 1570 by Abraham Ortelius of Antwerp. In crude outline, the Theatrum laid out the world and its largely in-tact ecosystems for imminent colonization. Almost 450 years later, this 'Atlas for the End of the World' rakes over the remains. Of course, it is not the end of the world at all, rather, it is the end of Ortelius' world - a world where it was thought ecosystems (and peoples) could be exploited without consequence, ad infinitum.
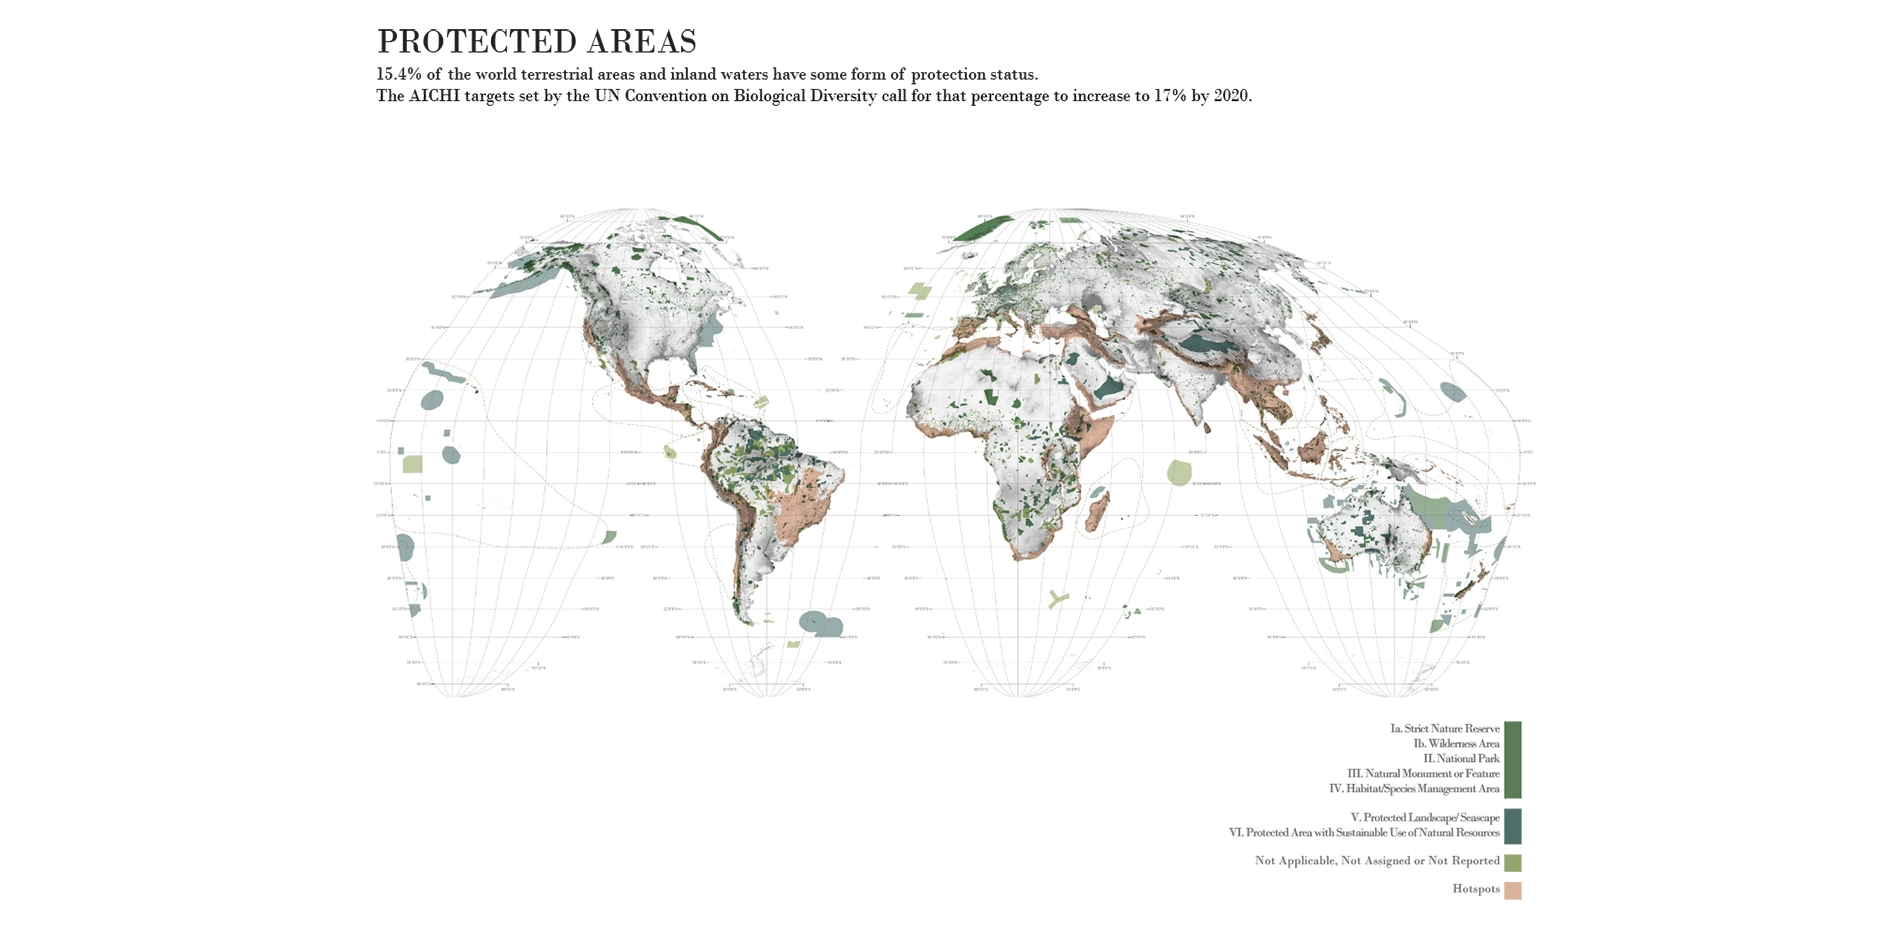
Specifically, the Atlas surveys the status of, and conflicts between conservation, land-use and urban growth in the world's 36 biodiversity hotspots - regions which by definition harbor the most threatened and unique biodiversity on earth. It does this by comparing the quantity of protected area in the hotspots against the global target of 17% as set by the Convention of Biological Diversity (CBD) and to which 196 nations are signatory.
The world's current estate of protected areas amounts to 15.4% of global terrestrial area. To reach the 17% target means the world needs to secure an additional 1.6% by 2020. This sounds trivial but in fact it equates to almost 700,000 Central Parks. The overarching question this research asks is where, as a matter of priority, this land should be protected?
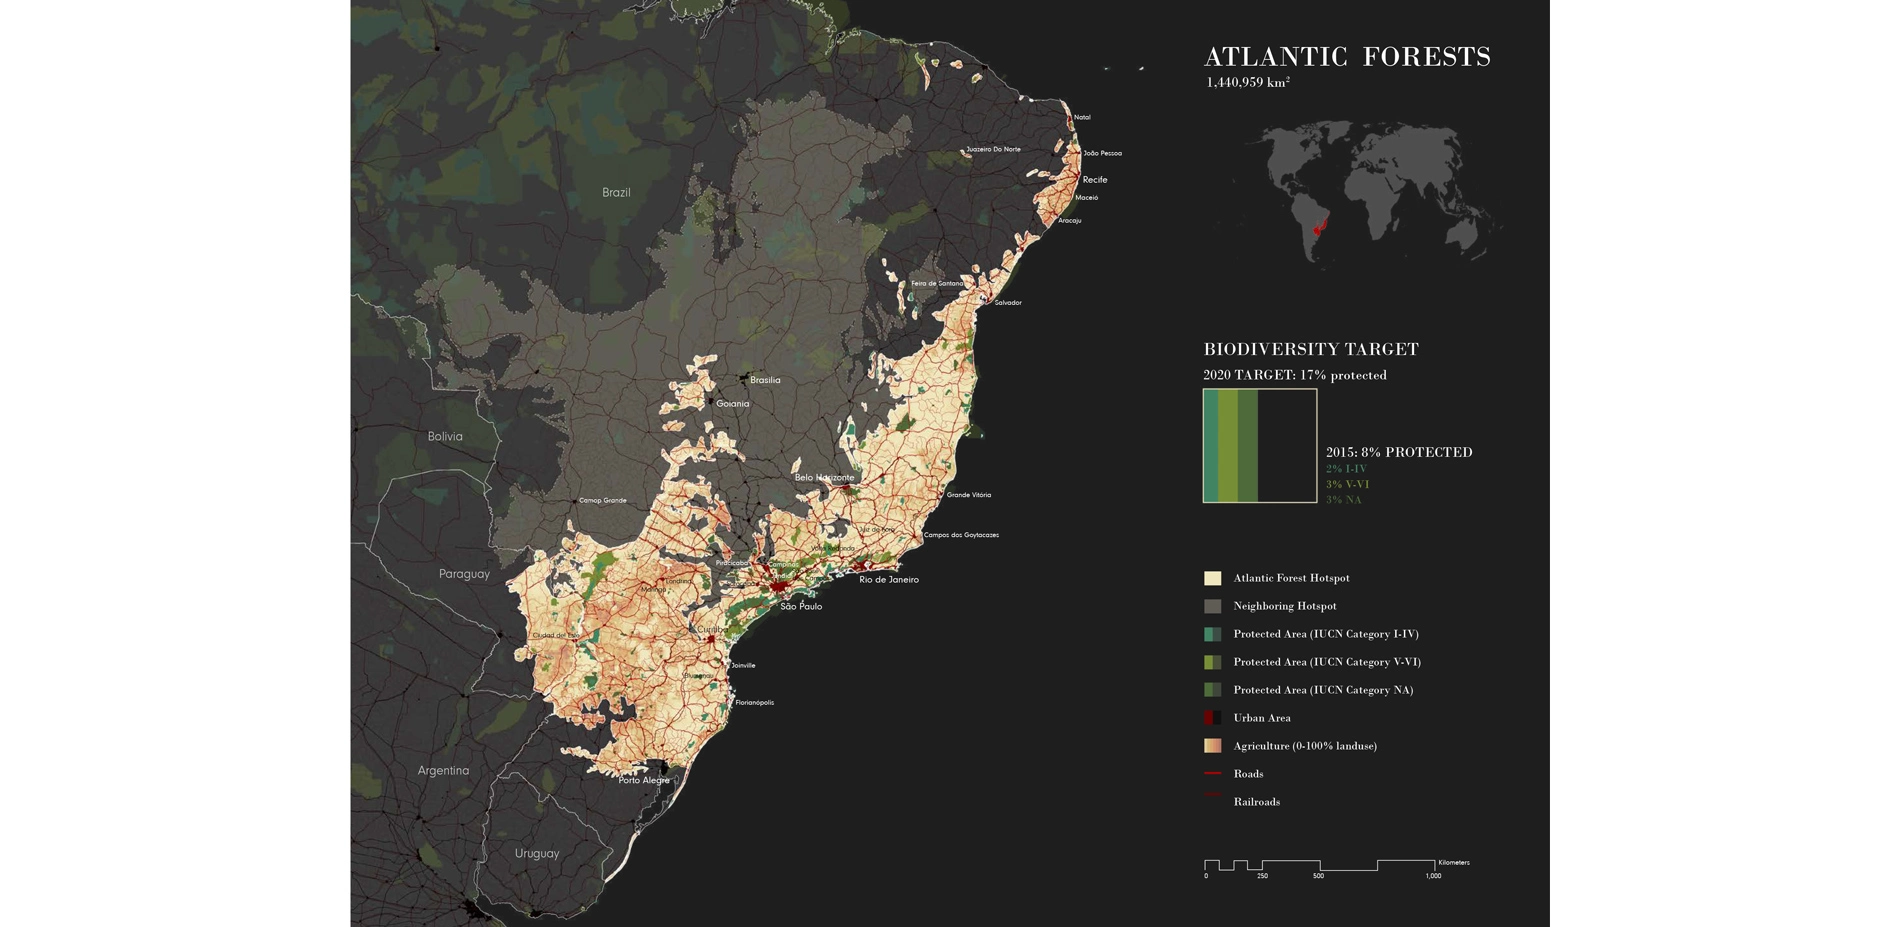
The method used to conduct the analytical phase of this research began with a rasterized depiction of global land-cover classification. The raster was converted into a shapefile (vector), and specific layers such as agriculture, barren land, water/ice and urban areas, removed. Importantly, we modified the remnant habitat delineation derived from our GIS analysis by first subtracting any overlapping protected areas.
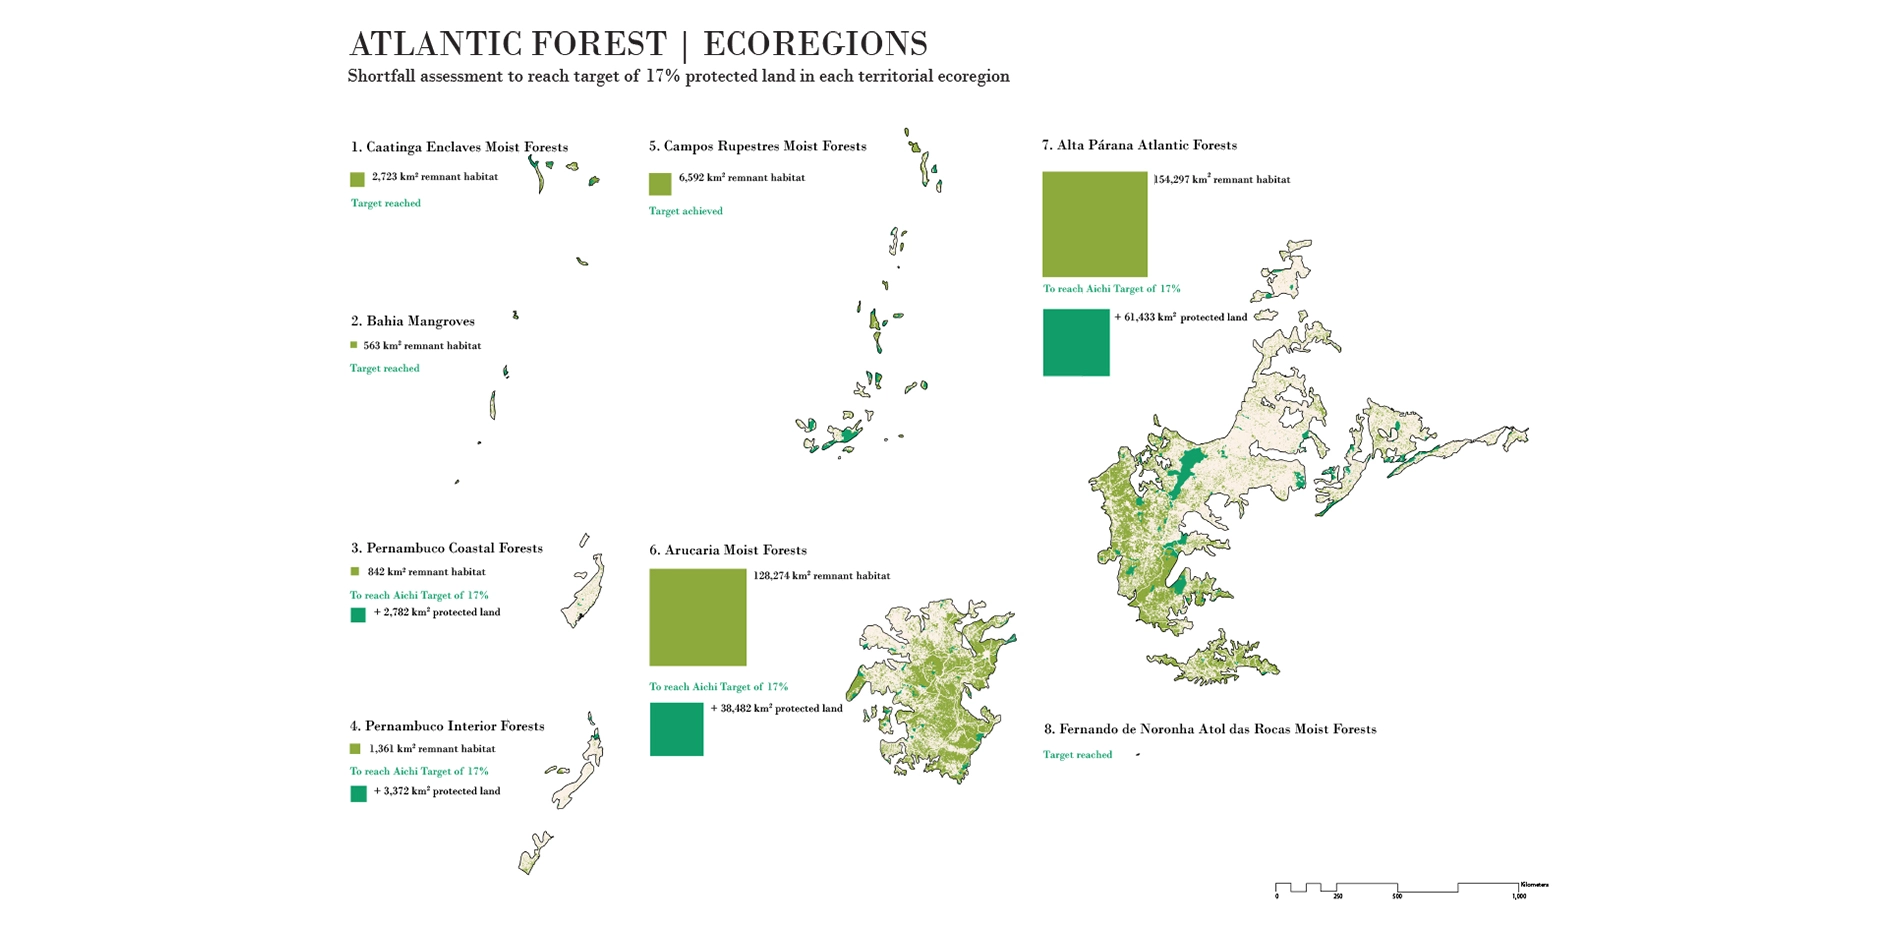
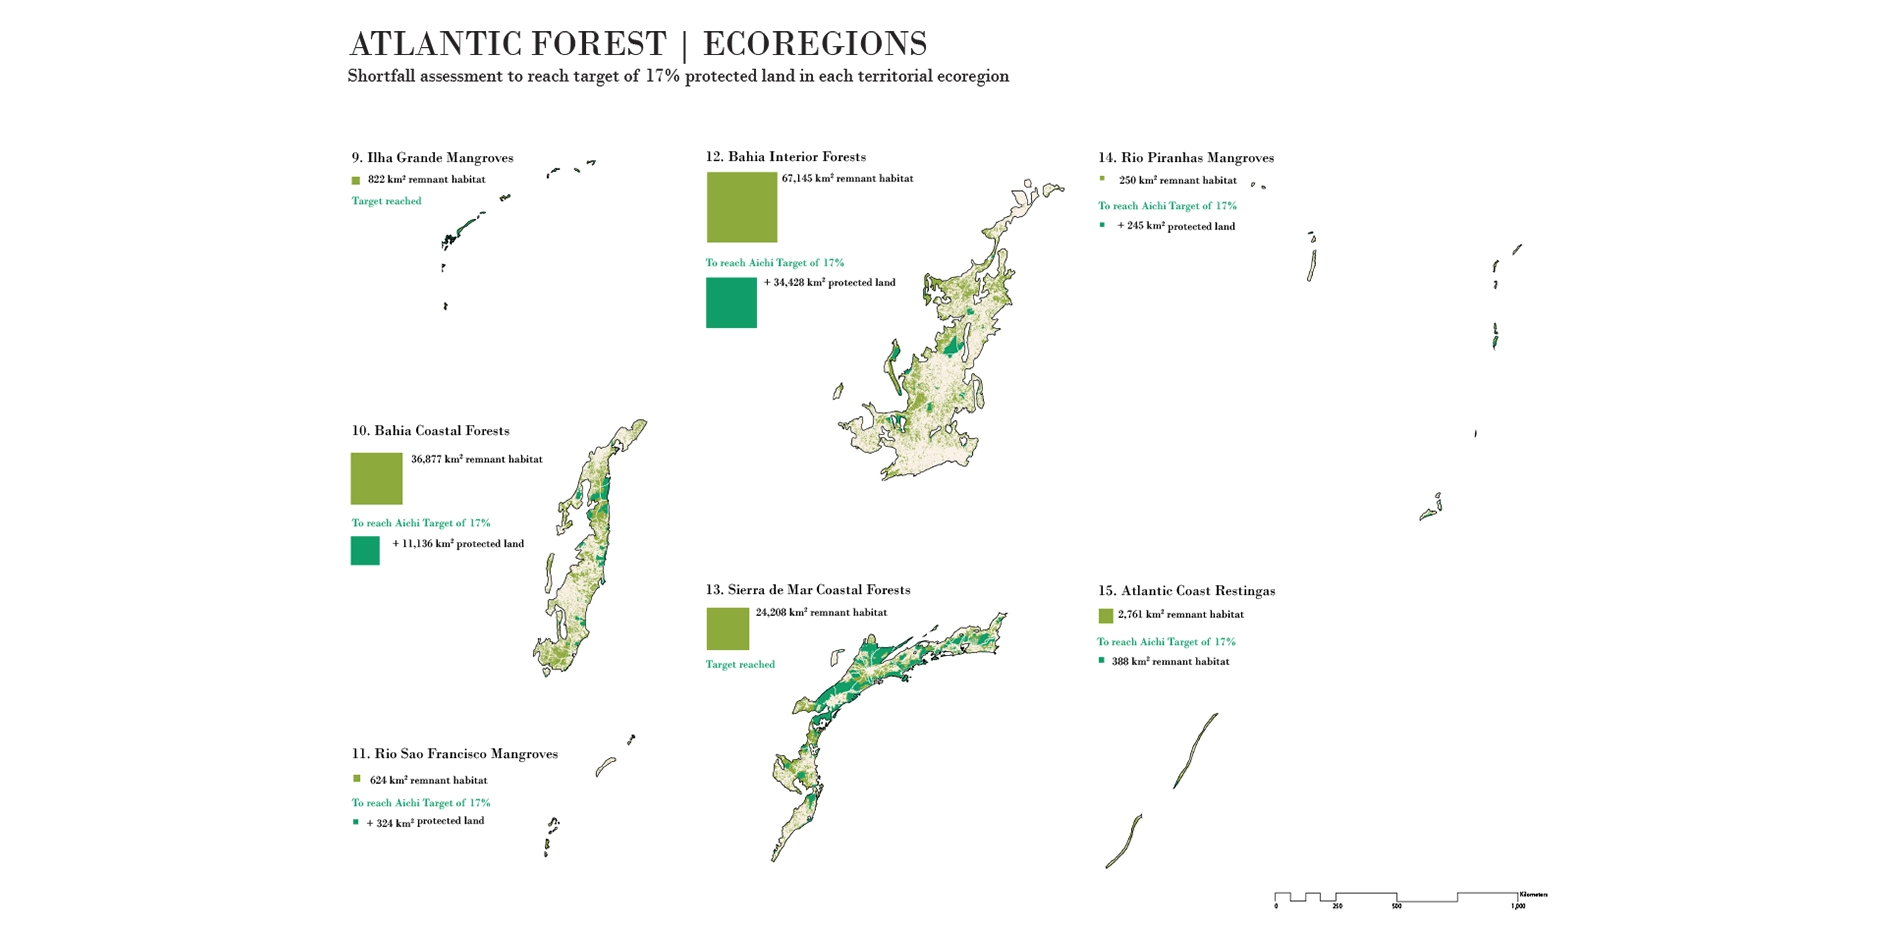
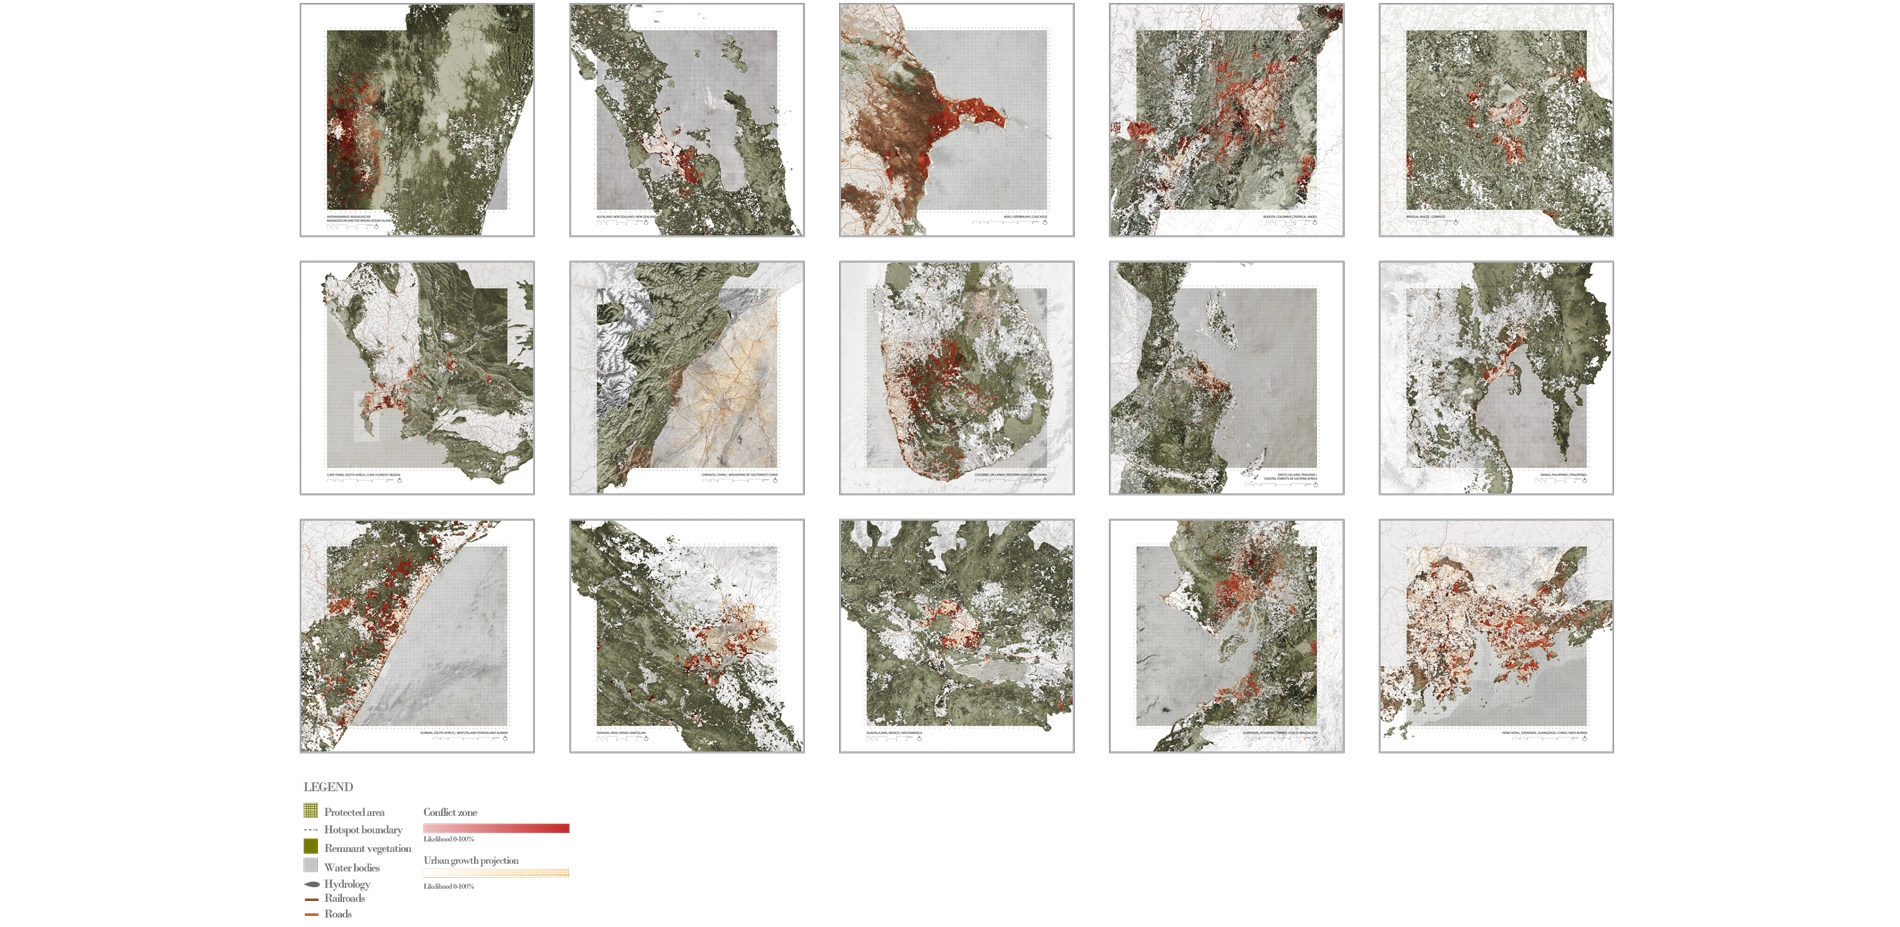
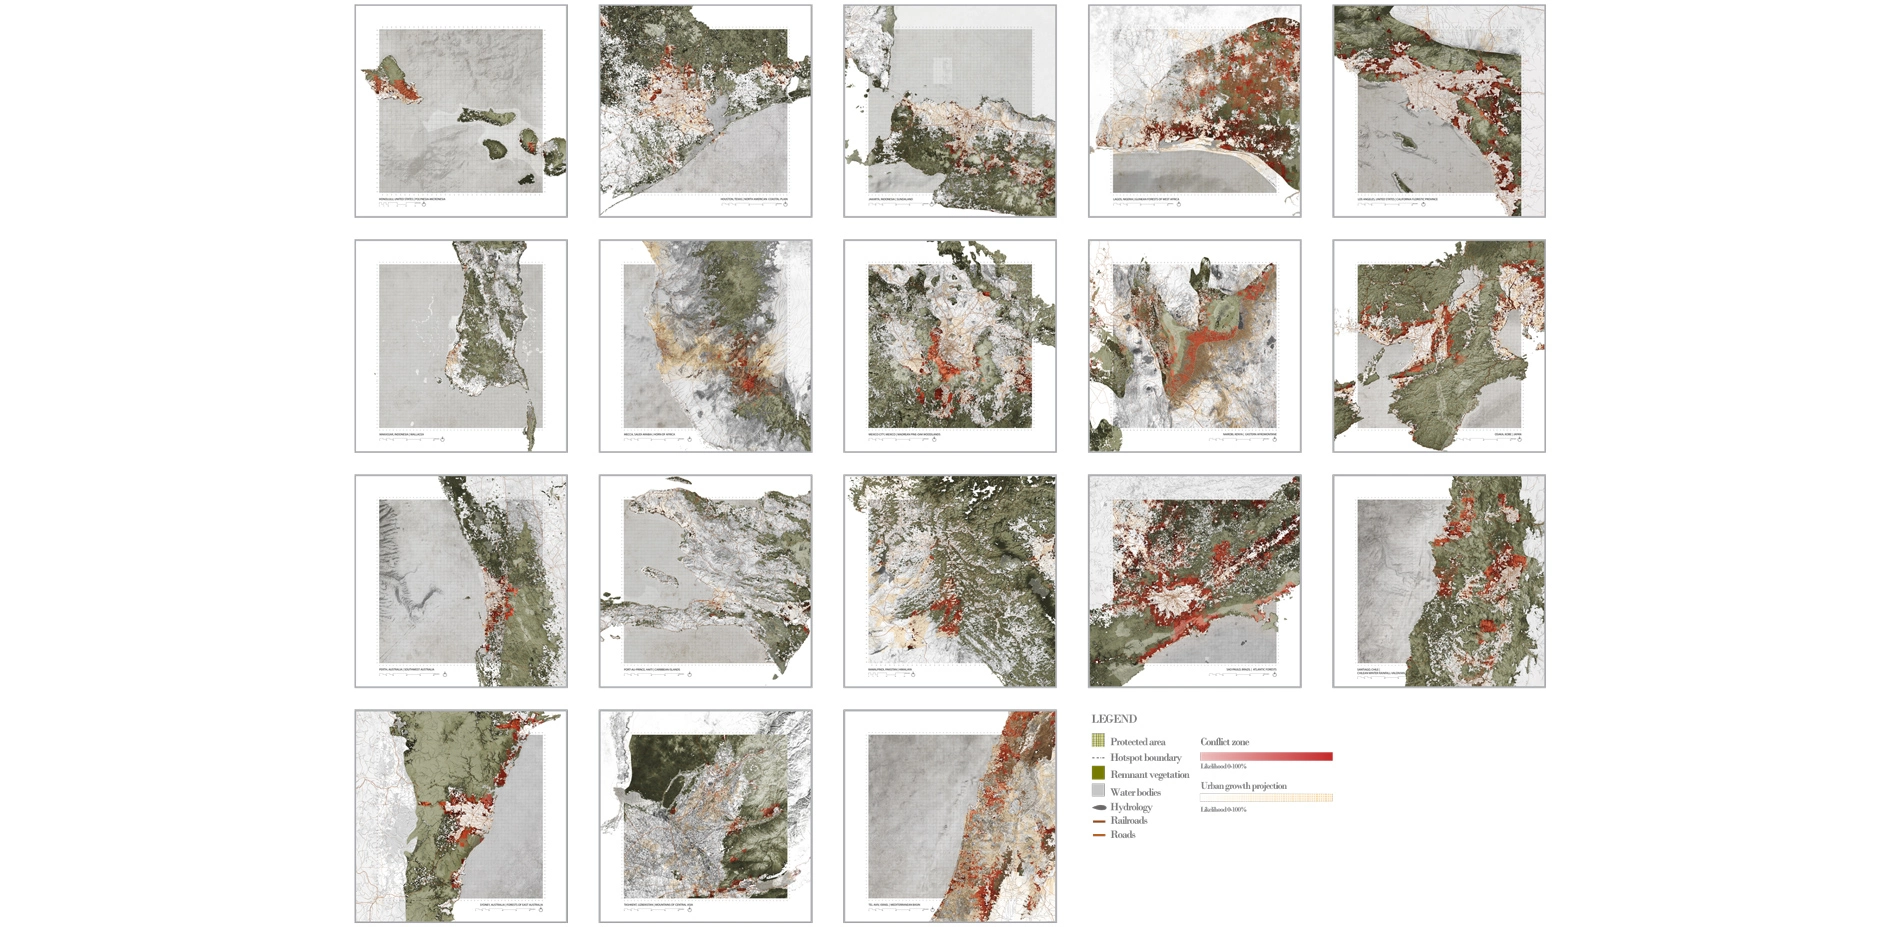
The research found that 21 of 36 hotspots currently fall well short of reaching the CBD's 17% protected area target. In a further and finer grained phase of analysis it was determined that 221 of 391 of the ecoregions which constitute the world's hotspots also fall well short of meeting the 17% target. As shown in the accompanying illustrations, our mapping shows how much additional land needs to be protected if each hotspot was to reach the 17% target. Similarly, at the ecoregional level the quantities of protected area and remnant habitat are re-drawn as squares at the same scale as the original map in order to clearly demonstrate the additional land area within a given ecoregion that must be protected to meet the target (teal-green), and how much viable habitat remains in which to do so (light green).
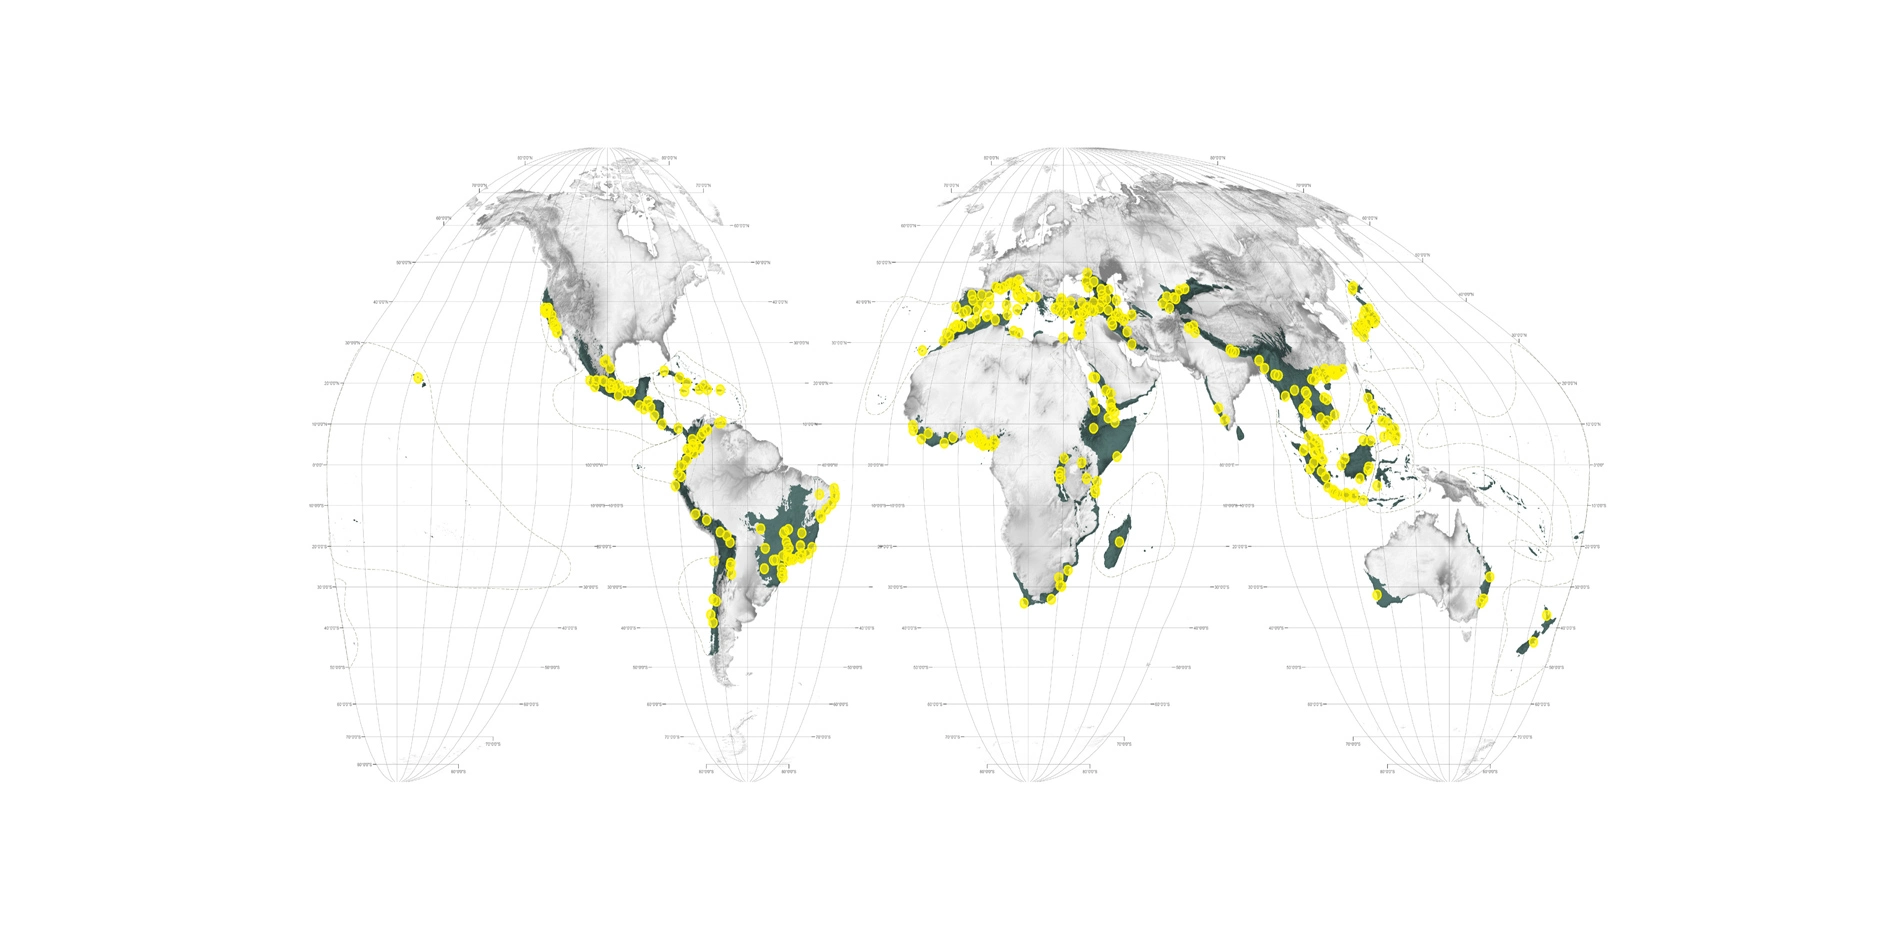
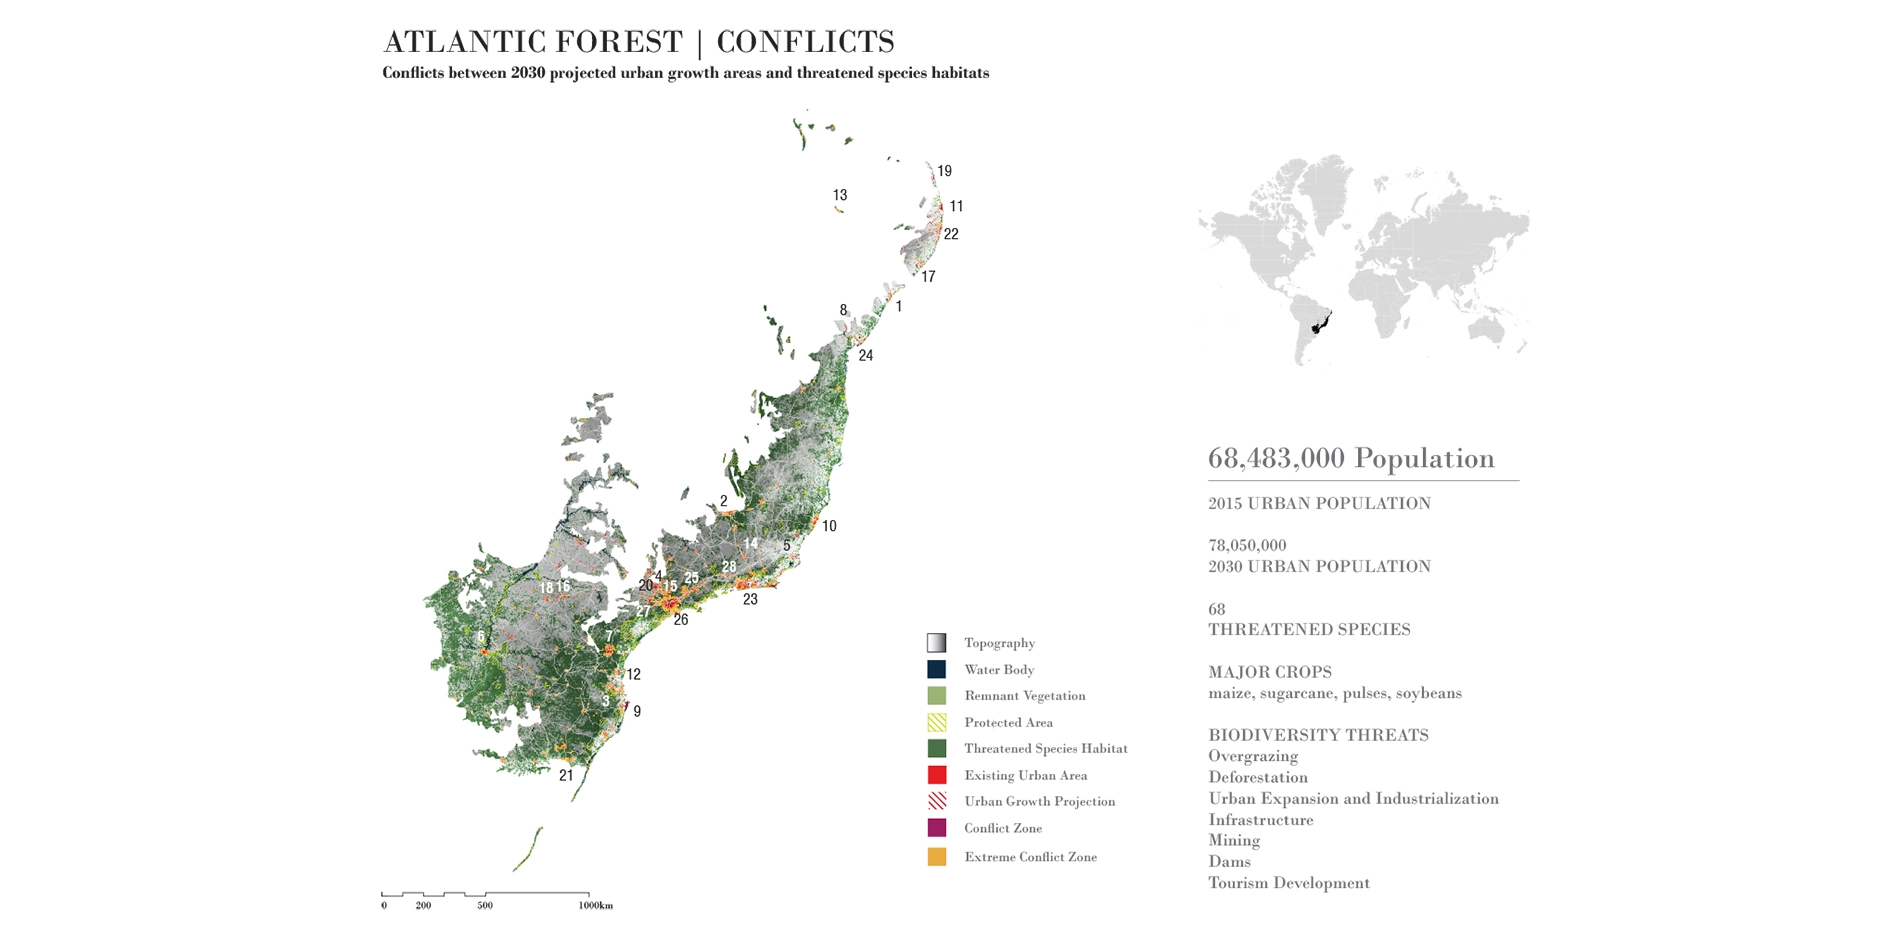
In an effort to move beyond the orthodoxy of conservation as only the designation of protected areas, and to connect regional land use to the dynamics of urbanization, in a second phase of this research we examined the 422 cities (300,000 people or more) in the 36 hotspots. The purpose of this was to identify which cities are sprawling, and can be expected to continue to sprawl, in direct conflict with remnant habitat and endangered species at their peri-urban edges. We found direct conflict to be the case in 383 out of 422 cities. Moreover, according to desk-top analysis we found that an overwhelming majority of these cities have next to no semblance of planning to address this calamity. By way of example, the cities in one hotspot (the Atlantic Forest) are illustrated. On these small, circular maps of each city the color yellow indicates areas of conflict based on 2030 growth forecasts.
The method used to identify cities that are sprawling in conflict with biodiversity was to overlay 2030 growth projections sourced from the Seto Lab at Yale University with remnant vegetation data from the Global Land Cover Facility and the IUCN Red List of ranges for 3,245 mammal species that are either critically endangered or endangered.
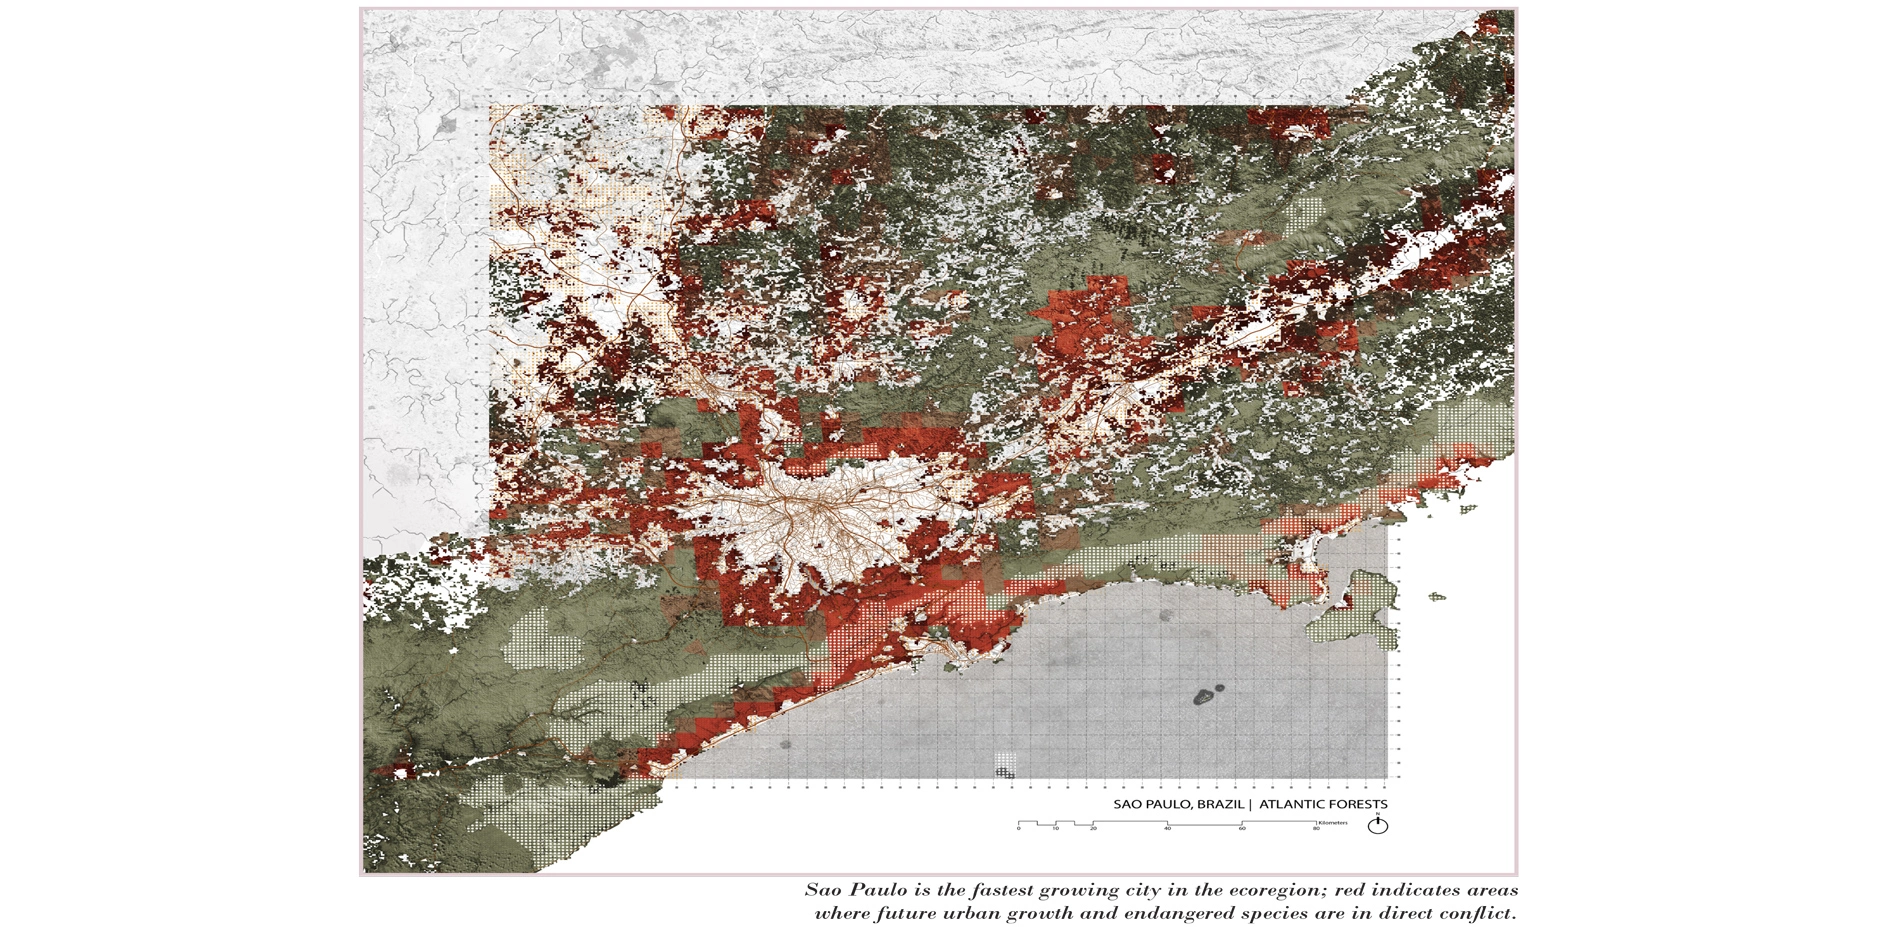
Becasue the resolution of these 'conflict maps' is quite low (5km x 5km pixels), in the third and most recent phase of this research, a sample set of 33 of the largest and fastest growing cities in the hotspots was selected for more detailed analysis. In each of these 'hotspot capitals' (such as Sao Paulo in the case of the Atlantic Forest hotspot) the peri-urban land area where urban growth and endangered species are on a direct collision course has been identified at high resolution. This third phase of the research was presented to the World Urban Forum in Kuala Lumpur in February, 2018. There, we argued that these 33 cities should assume a leadership role and form a global alliance for knowledge creation and knowledge sharing. This idea has been well received by the major NGOs working in this context.
This research has resulted in over 800 new maps and supporting text directly addressing the planning and management of land in the world's most significant biological regions. Breaking with the academic orthodoxy of producing books for our small community of peers, this research has been broadly disseminated as an interactive website. The research is organized and presented so as to appeal to experts and the general public and includes a series of 40 (original) world maps and related art work. Since its launch on Earth Day (April 22nd) in 2017, the website (at the time of writing) has received over 170,000 unique visitors - an average of well over 500 per day. The research has been further disseminated through over 30 news outlets, most notably National Geographic and Scientific American which together reach more than 25 million people.
The geographic identification of these results (target shortfalls and peri-urban conflict zones) at such a scale is unprecedented. By accurately identifying these 'crisis landscapes' both nations and the big environmental NGOs can better coordinate and prioritize their efforts to mitigate further biodiversity loss. To that end a consortium including the authors in association with the Nature Conservancy, ICLEI, the Stockholm Resiliency Center and the Helmholz Center for Environmental Research has now been formed to determine a set of 8 city-based demonstration projects that will aim to show how, through planning, design and local community engagement, urban growth and biodiversity can better co-exist. For landscape architecture to be at the table negotiating such issues, at such scale, with such organizations is a breakthrough.
From the ASLA's perspective what is also noteworthy is that the the authors of this research have used it to argue for the profession of landscape architecture to be directly involved in these landscapes – landscapes which have hitherto been dominated by the science of conservation on the one hand, and economic development on the other. In this way, this research intentionally positions the profession of landscape architecture as the arbiter between conservation and urban growth in the 21st century on a global scale. As a research project the Atlas was conceived, and now serves to open a pathway for both the profession and the academy of landscape architecture to genuinely expand its purview and make significant steps toward realizing its global mandate of stewardship.
-
Lead Designer
- Richard Weller
Landscape Architect of Record/Firm
- University of Pennsylvania
Project Credits
- Mike Biros
- Dr. Tatum Hands
- Claire Hoch
- Chieh Huang
- Renhui Zhao
- Nanxi Dong
- Zuzanna Drozdz
- Josh Ketchum
- Rong Cong
- Darcy van Buskirk
- Krista Reimer
- Katie Black
- Matthew Wiener
- Shuo Yan
Advertisement
Related Awards
Honor Award, Research
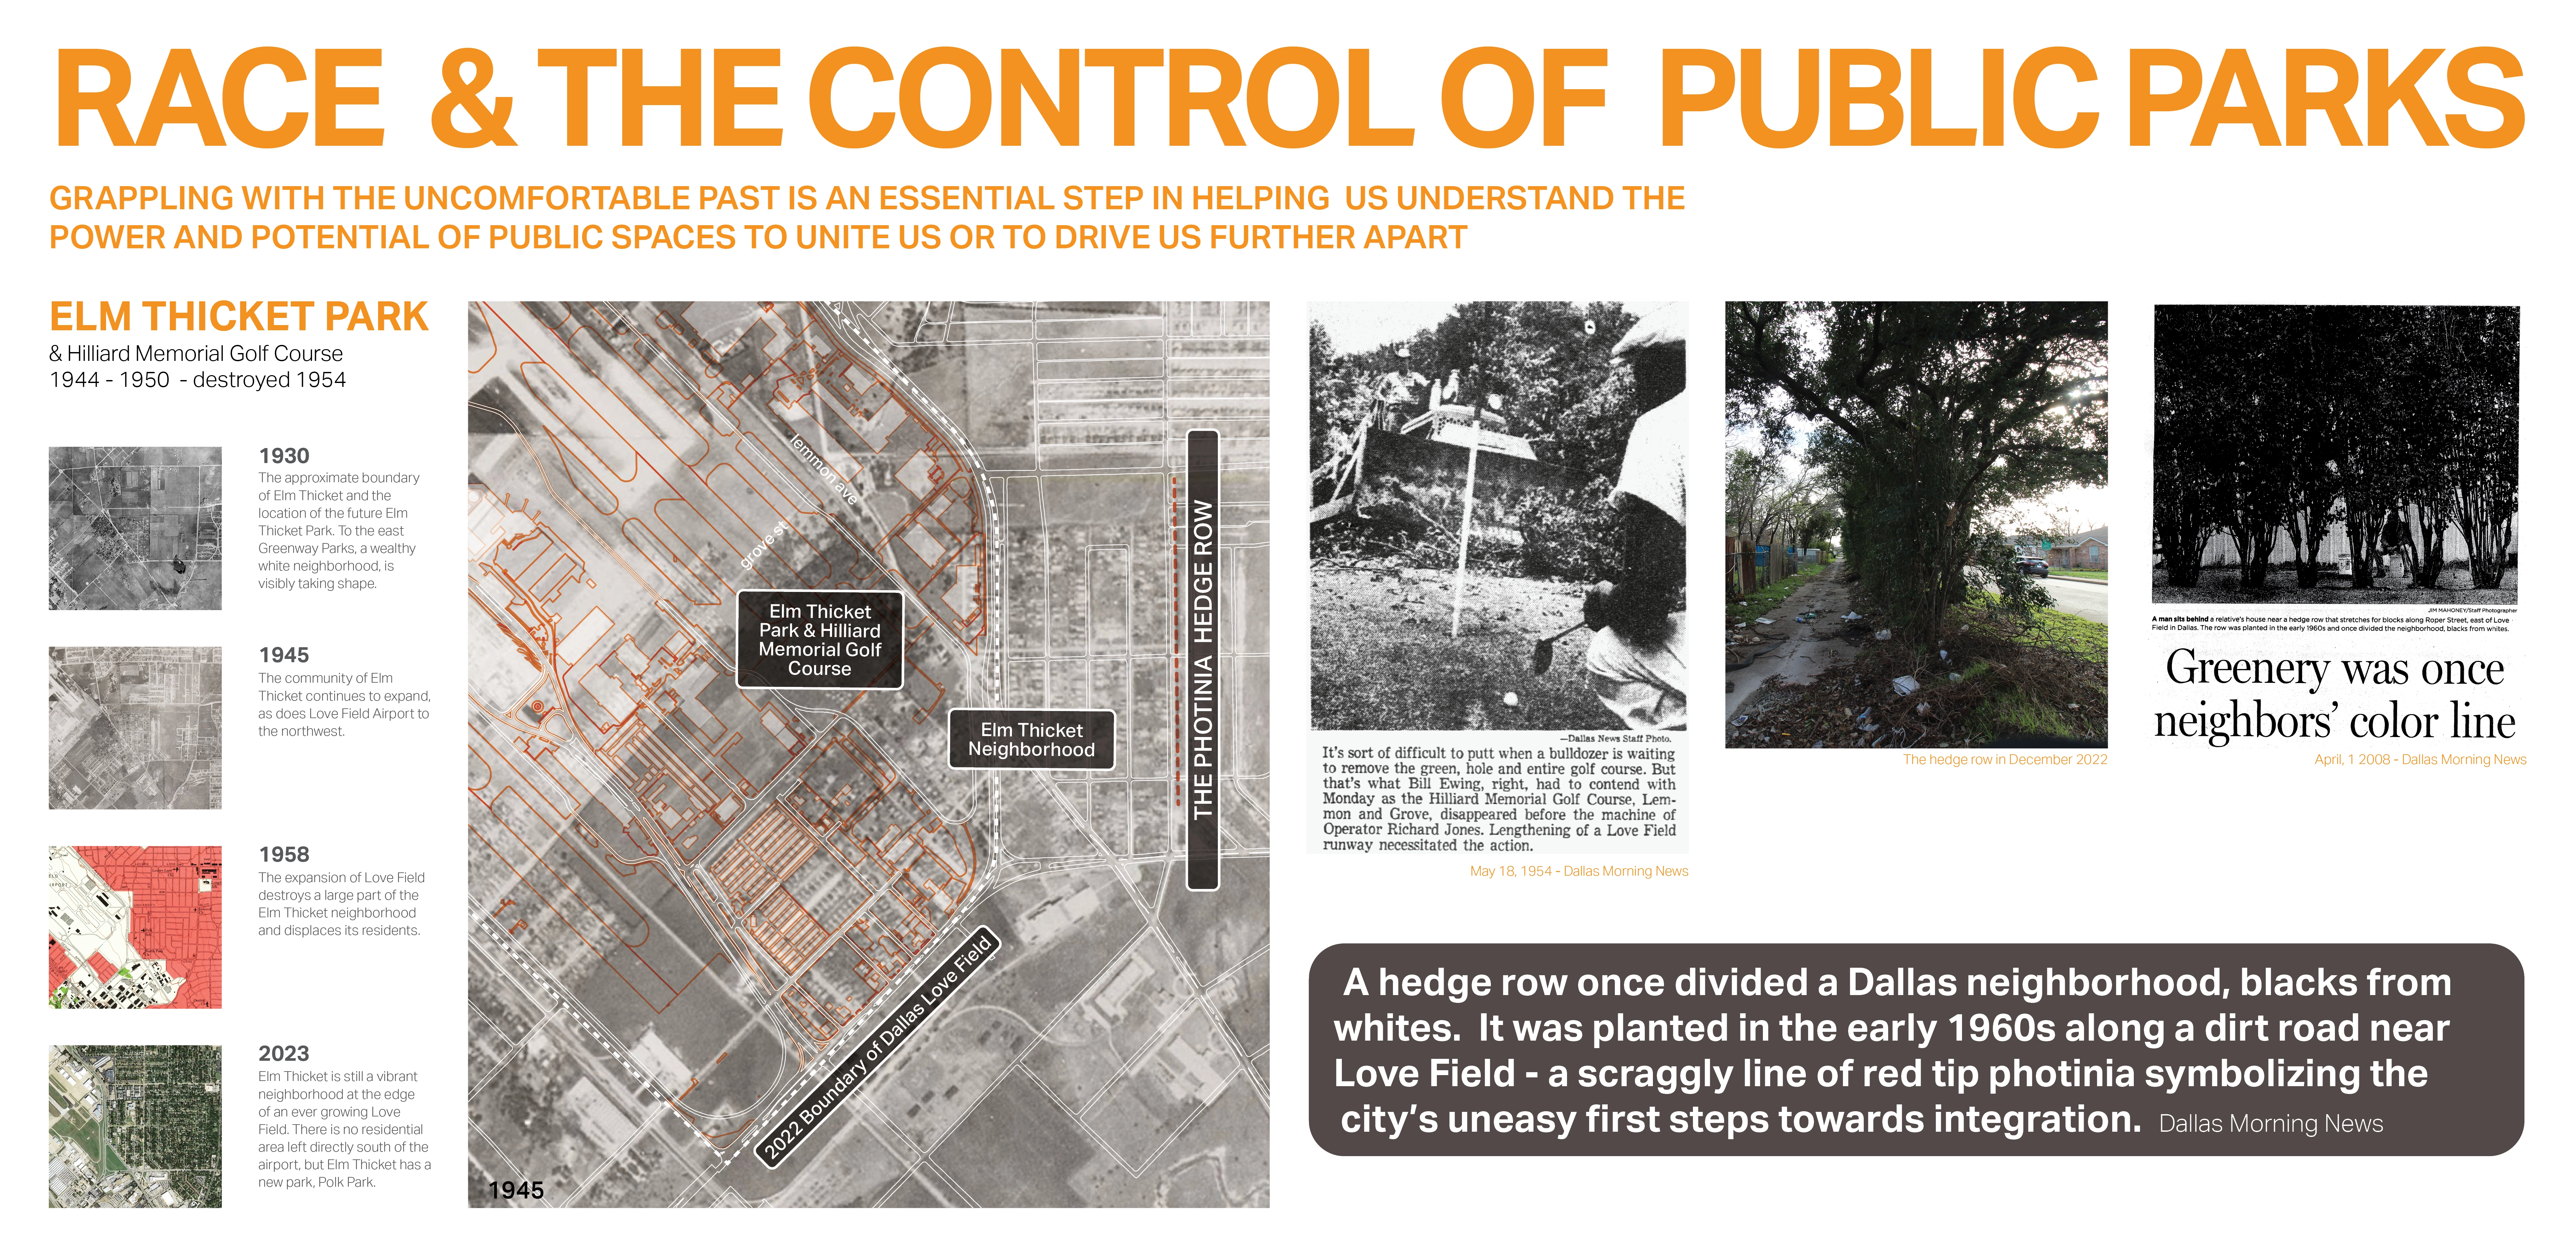
Race and the Control of Public Parks
This research uses a century long historical analysis of the public park system in Dallas, Texas, USA to uncover the physical and psychological ways in which public landscapes and the works of landscape architects have segregated urban spaces and how we might fight against these design practices. Through reframing past practice this work seeks to create a method for informing design thought and practices that seek to create a more just built environment.