


Honor Award
Green Infrastructure Master Plan
Hawkins Partners, Inc Nashville, TN
Client: Metropolitan Government of Nashville and Davidson Country / Metro Water Services
 Close Me!
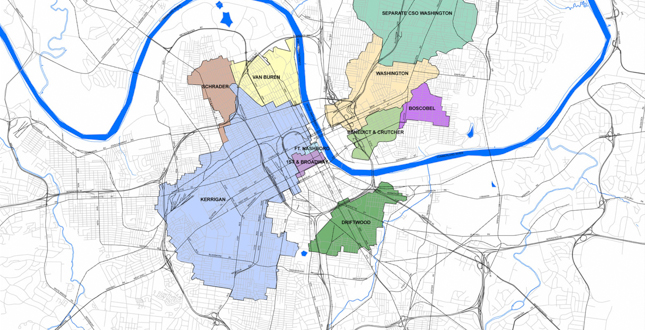
The Stormwater Master Plan District encompasses 7,878 acres and is divided into ten sub-basin areas. The district currently generates 765.2 million gallons of combined sewer overflow. This plan identified potential reduction of 3.5 B gallons/year through green infrastructure.
Download Hi-Res ImageImage: Hawkins Partners, Inc.
Image 1 of 15
 Close Me!
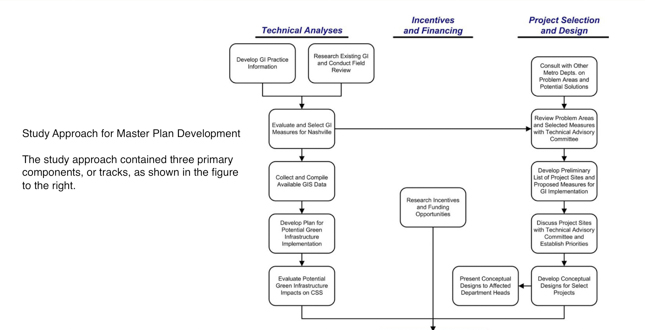
Study Approach for Master Plan Development. The study approach contained three primary components, or tracks, as shown in the figure to the right.
Download Hi-Res ImageImage: Hawkins Partners, Inc.
Image 2 of 15
 Close Me!
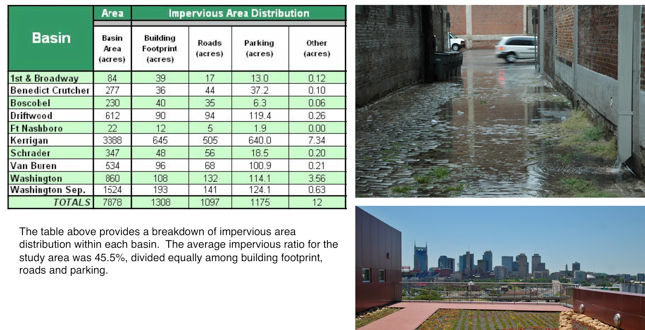
The table above provides a breakdown of impervious area distribution within each basin. The average impervious ratio for the study area was 45.5%, divided equally among building footprint, roads and parking.
Download Hi-Res ImageImage: Hawkins Partners, Inc.
Image 3 of 15
 Close Me!
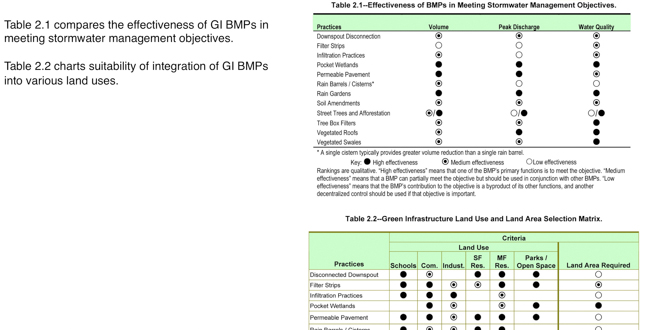
Table 2.1 compares the effectiveness of GI BMPs in meeting stormwater management objectives.Table 2.2 charts suitability of integration of GI BMPs into various land uses.
Download Hi-Res ImageImage: Hawkins Partners, Inc.
Image 4 of 15
 Close Me!
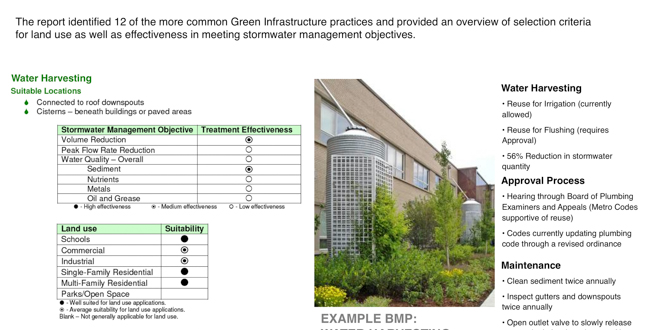
The report identified 12 of the more common Green Infrastructure practices and provided an overview of selection criteria for land use as well as effectiveness in meeting stormwater management objectives.
Download Hi-Res ImageImage: Hawkins Partners, Inc.
Image 5 of 15
 Close Me!
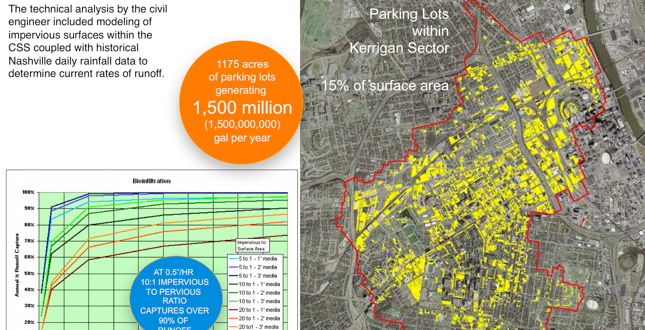
The technical analysis by the civil engineer included modeling of impervious surfaces within the CSS coupled with historical Nashville daily rainfall data to determine current rates of runoff.
Download Hi-Res ImageImage: Hawkins Partners, Inc.
Image 6 of 15
 Close Me!
GIS data facilitated technical analysis of potential volume reductions using region specific evaluation criteria developed by the team for 4 different GI practices, including water harvesting, green roofs, urban trees and structural control measures (permeable pavement/bioinfiltration)
Download Hi-Res ImageImage: Hawkins Partners, Inc.
Image 7 of 15
 Close Me!
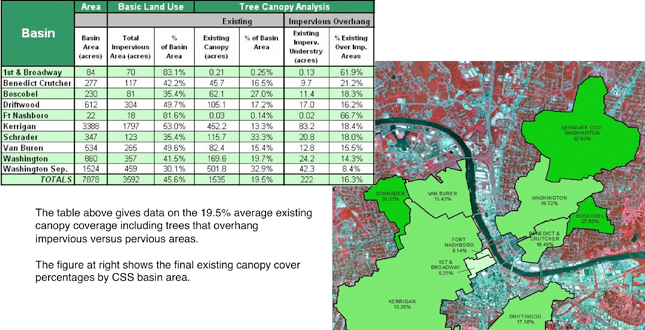
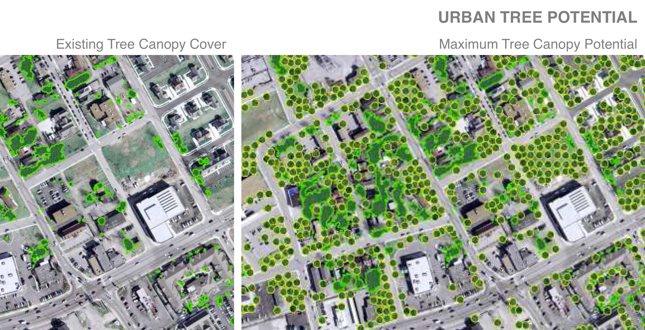
The table above gives data on the 19.5% average existing canopy coverage including trees that overhang impervious versus pervious areas. The figure at right shows the final existing canopy cover percentages by CSS basin area.
Download Hi-Res ImageImage: Hawkins Partners, Inc.
Image 8 of 15
 Close Me!
Detailed GIS analysis shows an estimated 51,800 acceptable new tree planting sites increasing the percent canopy coverage average to 30%. If all the potential trees were planted the volume removal would amount to an estimated 660 million gallons annually.
Download Hi-Res ImageImage: Hawkins Partners, Inc.
Image 9 of 15
 Close Me!
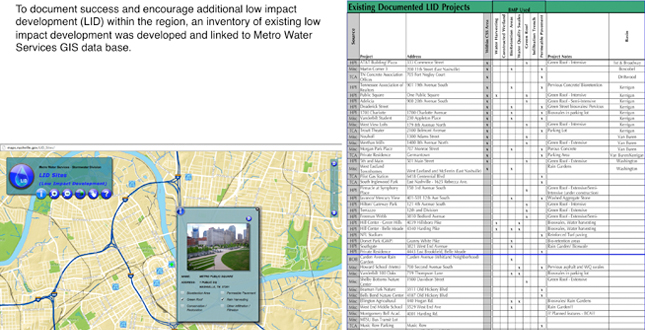
To document success and encourage additional low impact development (LID) within the region, an inventory of existing low impact development was developed and linked to Metro Water Services GIS data base.
Download Hi-Res ImageImage: Hawkins Partners, Inc.
Image 10 of 15
 Close Me!
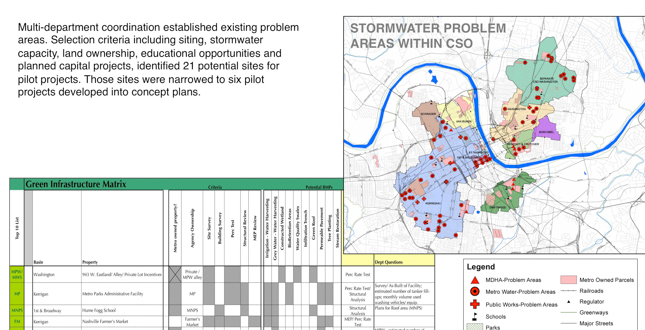
Multi-department coordination established existing problem areas. Selection criteria including siting, stormwater capacity, land ownership, educational opportunities and planned capital projects, identified 21 potential sites for pilot projects. Those sites were narrowed to six pilot projects developed into concept plans.
Download Hi-Res ImageImage: Hawkins Partners, Inc.
Image 11 of 15
 Close Me!
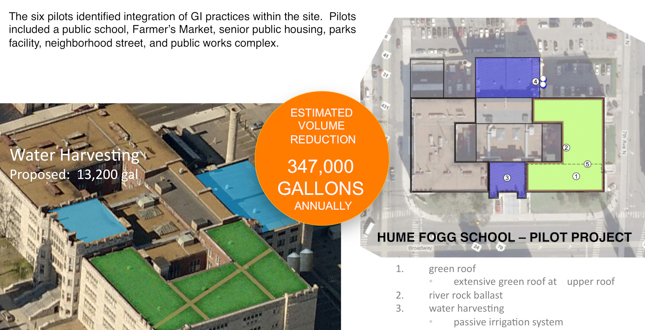
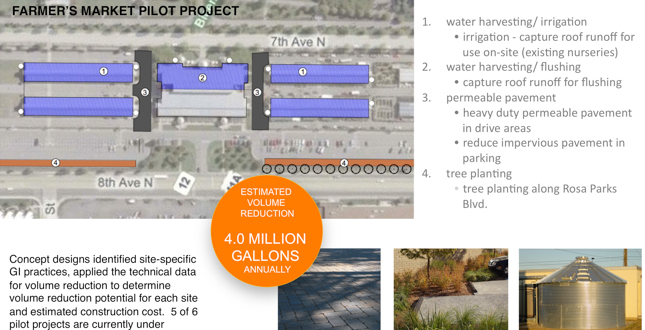
The six pilots identified integration of GI practices within the site. Pilots included a public school, Farmer's Market, senior public housing, parks facility, neighborhood street, and public works complex.
Download Hi-Res ImageImage: Hawkins Partners, Inc.
Image 12 of 15
 Close Me!
Concept designs identified site-specific GI practices, applied the technical data for volume reduction to determine volume reduction potential for each site and estimated construction cost. 5 of 6 pilot projects are currently under development.
Download Hi-Res ImageImage: Hawkins Partners, Inc.
Image 13 of 15
 Close Me!
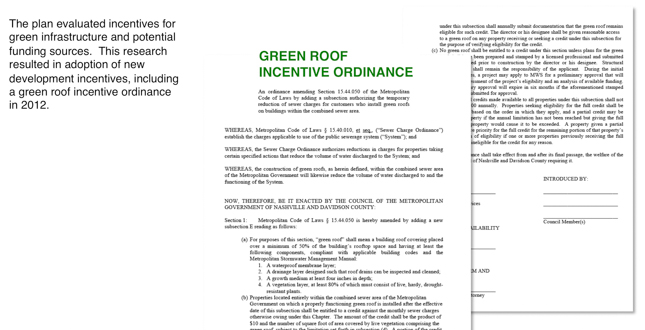
The plan evaluated incentives for green infrastructure and potential funding sources. This research resulted in adoption of new development incentives, including a green roof incentive ordinance in 2012.
Download Hi-Res ImageImage: Hawkins Partners, Inc.
Image 14 of 15
 Close Me!
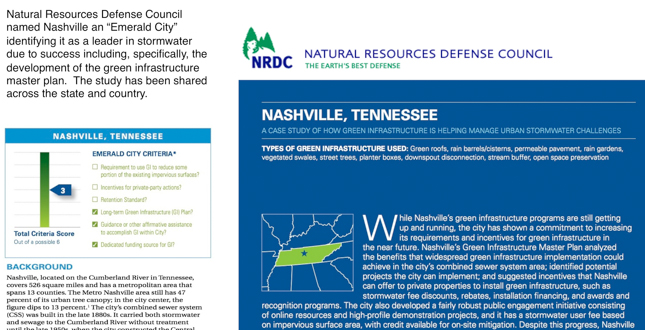
Natural Resources Defense Council named Nashville an “Emerald City” identifying it as a leader in stormwater due to success including, specifically, the development of the green infrastructure master plan. The study has been shared across the state and country.
Download Hi-Res ImageImage: Hawkins Partners, Inc.
Image 15 of 15
Project Statement
The Green Infrastructure Master Plan was developed in response to the requirement for Nashville to analyze and provide estimated impacts for the reduction to the 765.2m gallons of combined sewer overflow (CSO) discharged to the Cumberland River each year through green infrastructure strategies. When completed, Nashville was one of only a handful of cities in the country with a comprehensive plan and has served as a model for similar CSO cities across the United States.
Project Narrative
—2013 Professional Awards Jury
In 2008, Nashville's 7878 acre combined sewer system (CSS) was designated as a stormwater planning district. Through this process Metro Water Services (MWS), in cooperation with the Metropolitan Planning Department, the Metropolitan Development and Housing Agency, and the Department of Public Works, was responsible to develop a “plan for the installation of Green Infrastructure (GI) within the Stormwater Master Planning District. Such plan for a Stormwater Master Planning District should include general location and type of installation and its estimated impact on the CSS.”
The plan's intent was to provide research for, and to analyze the benefits that, comprehensive green infrastructure strategies could achieve within the city's combined sewer system (CSS) area, given that the existing plan area generated 756.2 million gallons of combined sewer overflow each year into Nashville's streams and rivers based on the current 45.5% of impervious area within the CSS. By evaluating a range of data using GIS and infrared technology, the plan identified potential reductions of runoff totaling over 3.5 billion gallons through combinations of rainwater harvesting, green roofs, bioinfiltration and urban trees within the study area based on the application of a variety of site conditions including: modeling average rainfall, soil type, land use and impervious area.
The plan also identified and catalogued existing examples of green infrastructure in the area, identified potential pilot projects within the city based on department identified problem areas and reviewed and suggested incentives that could be offered for inclusion of green infrastructure within private developments.
Elements of the Green Infrastructure Master Plan
Green Infrastructure Practice
Typical GI practices include: downspout disconnection, filter strips, infiltration practices, pocket wetlands, permeable pavement, rain barrels/cisterns, rain gardens/bioretention soil amendments, street trees and afforestation, tree box filters, vegetated (green) roofs, vegetated swales, and assorted other practices. This section assesses and describes each practice in terms of: suitability, limitations, land area demands, relative costs, and maintenance.
Technical Analysis of Green Infrastructure
This section looks, in detail, at the land use characteristics of the CSS area and performs an analysis of the individual and large scale potential impacts of the employment of GI throughout the CSS area. Detailed analysis of Nashville rainfall using continuous simulation models to estimate the potential effectiveness of various practices in infiltrating, evapotranspiring, and harvesting runoff.
Key Findings from This Analysis
Rainfall Harvesting
The plan identified 1,300 acres of rooftop in the CSS area generating 1.36 billion gallons of runoff per year. Capturing 80% of all runoff from CSS area rooftops would require 62.3 million gallons of storage. Rooftops in Nashville generate, on average, about 65.5 gallons per day per 1,000 square feet of rooftop. A rainfall harvesting calculator tool was developed.
Green Roofs
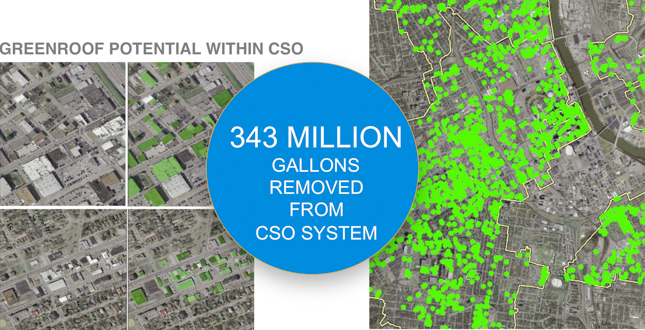
Based on criteria identifying flat roofs greater than 100 s.f. and utilizing 75% of that area (to account for HVAC, access and other needs), 708 buildings were identified that could provide 6.8 million s.f. of green roof area. Based on rainfall modeling, a 4” deep extensive green roof reduced runoff by 55-60% or 26.3 inches of rainfall annually. In total these rooftops could remove 112 million gallons from the CSS system per year.
Urban Trees
The CSS area has an existing average canopy cover of 19.5%. Detailed GIS analysis shows an estimated 51,800 acceptable new tree planting sites increasing the percent canopy coverage average to 30%. Continuous simulation modeling shows that a tree can intercept 7.26% of the annual rainfall falling on it, and transpire 54.8%. For the typical 30 foot diameter tree this amounts of 19,800 gallons per year. If all the potential trees were planted the volume removal would amount to an estimated 660 million gallons annually.
Bioinfiltration Areas, Permeable Surfaces and Tree Planters
Biofiltration describes a landscaped area that can store rainfall runoff for infiltration and evapotranspiration. Based on 10:1 impervious to pervious surface area ratio and 2 foot soil media, bioinfiltration can remove more than 80% of the runoff from an adjacent impervious surface such as a parking lot on an annual basis. There are 1175 acres of parking in the CSS area generating more than 1,500 million gallons per year. The runoff reduction of 80% amounts to 1,200 million gallons. Design curves for quick sizing were developed based on hourly continuous simulation modeling across a range of impervious to pervious ratios, media depths, and parent soil infiltration rates.
Green Infrastructure Projects
Existing Examples
To provide common understanding among all parties and to provide local examples of the best management practices, approximately 50 existing GI sites were identified in Nashville. The data was provided in GIS format along with a brief project description and summary of utilized BMPs in order to inform and educate the development community and promote adoption of these practices.
Pilot Project Identification
To identify potential sites for future and demonstration GI projects interviews were conducted with the Metro Planning Department, Metro Water Services, Metro Public Works, and the Metropolitan Development and Housing Agency. Each department provided their current overflow problem areas within the CSS. Design objectives were developed to aid in selection criteria. Objectives included demonstration of a variety of BMPs, educational opportunities, sustainability benefit beyond stormwater, geographic distribution, complexity of implementation and proximity to identified problem areas. Following an initial screening of 21 potential sites, six project locations were identified as pilot project sites. The pilot sites included a public high school, farmer's market, neighborhood street right of way, high-rise public housing for seniors, parks facility and a public works complex.
Each of the pilot projects was evaluated and a concept plan developed to address the specific problem statement. Utilizing the methods evaluated and researched in this study, an estimated stormwater runoff volume reduction was calculated and an estimated construction cost was developed for each pilot. Pilot projects ranged in cost from $88,000 to $1,200,000 and runoff volume reduction ranged from 340,000 gallons per year to 6.1 million gallons per year.
Green Infrastructure Incentives and Financing
Existing incentives were reviewed to determine the effectiveness of the incentive offered and potential incentives were evaluated for their effectiveness to encourage the use of GI for retrofitting existing developments and incorporating “green” stormwater practices in future developments. Five potential new incentives were selected for further consideration for implementation in Metro Nashville: Stormwater Fee Discounts, Rebates and Installation Financing, Development Incentives, Grants, and Awards & Recognition Programs.
Outcomes
Since completion in 2009, other plans have utilized the findings of this study as a basis for additional planning and policy, including the Nashville Open Space Master Plan (2010), the Stormwater Volume 5 Low Impact Development Manual (2011), and the Green Roof Incentive Ordinance (2012). Five of the six identified pilot projects are currently in development.
Landscape Architecture Significance
According to the National Research Council, “Stormwater runoff from the built environment remains one of the great challenges of modern water pollution control, as this source of contamination is a principal contributor to water quality impairment of waterbodies nationwide.” The green infrastructure solutions to these problems are largely, if not entirely, landscape architecture solutions within our built environment. This study provides a documented guideline for how to plan for and utilize best management practices for the highest benefit in this particular region based on region-specific data.
Project Resources
Hawkins Partners, Inc.
Kim Hawkins, ASLA
Laura Schroeder, ASLA
Chris Whitis
Civil Engineer / GIS
AMEC Environmental and Infrastructure, Inc.
Funding Input
Urban Blueprint
Incentives Input
Low Impact Development Center, Inc.